Automated Systems
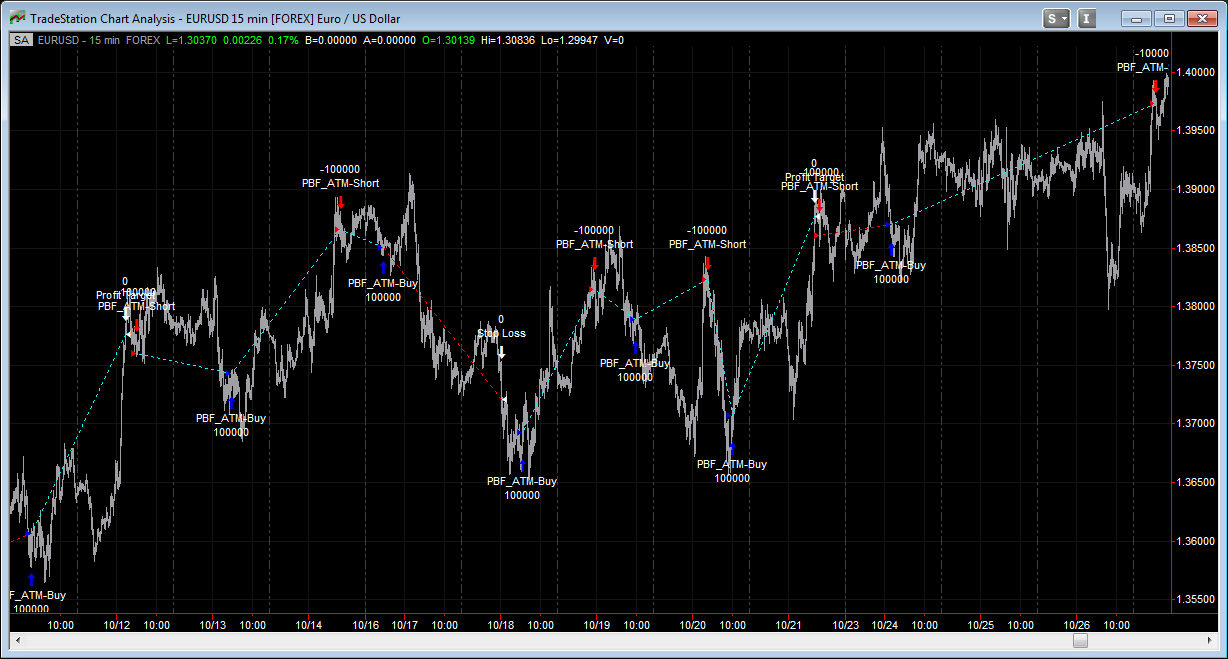
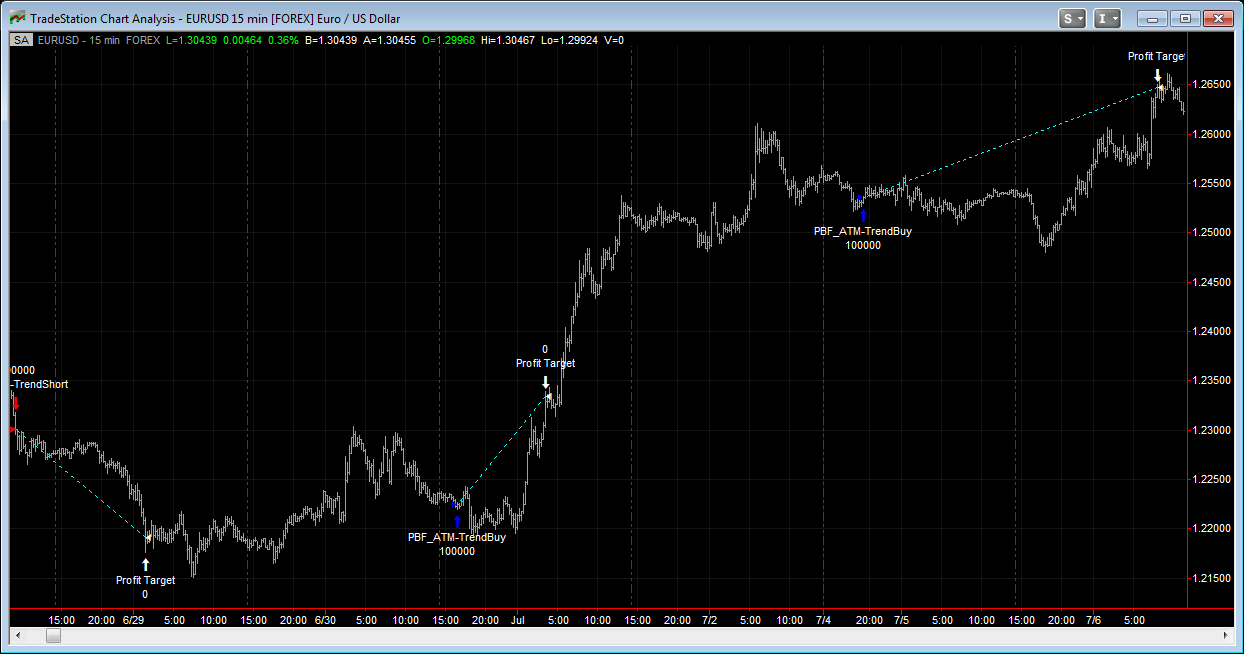
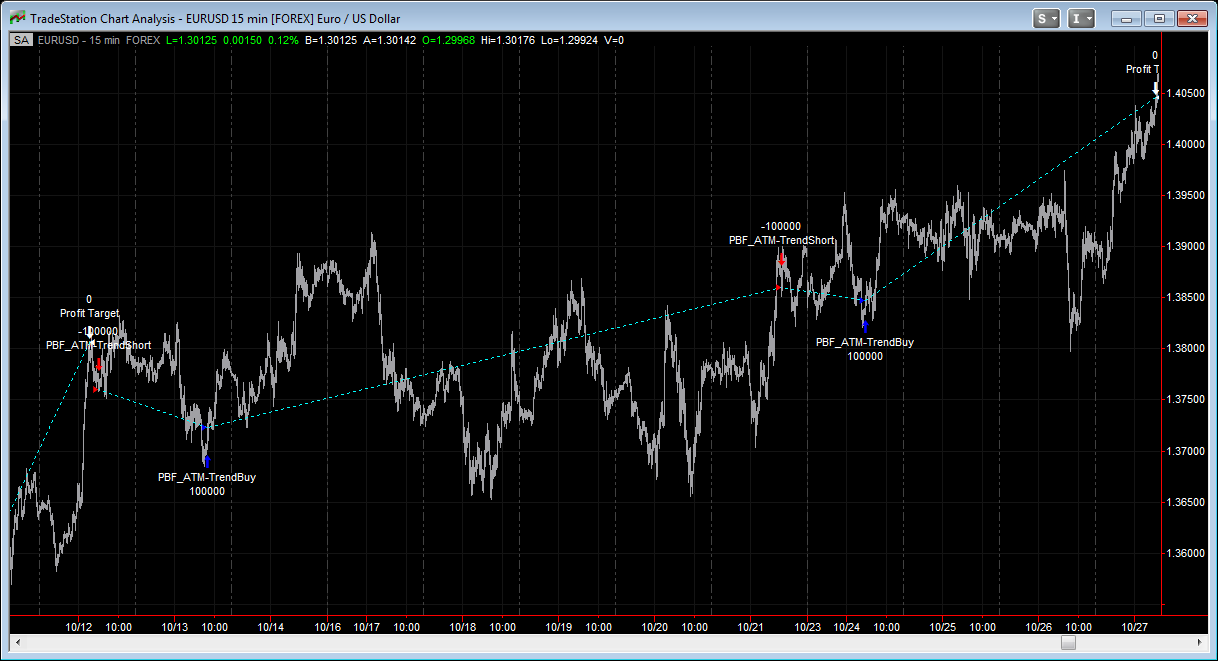
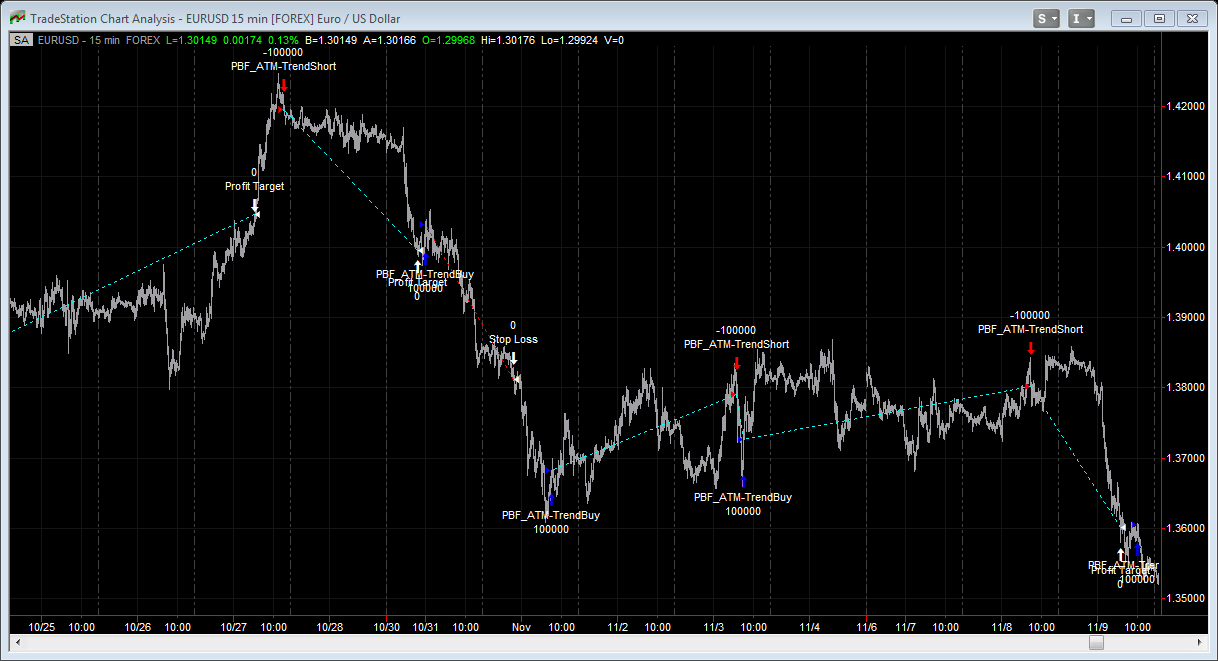
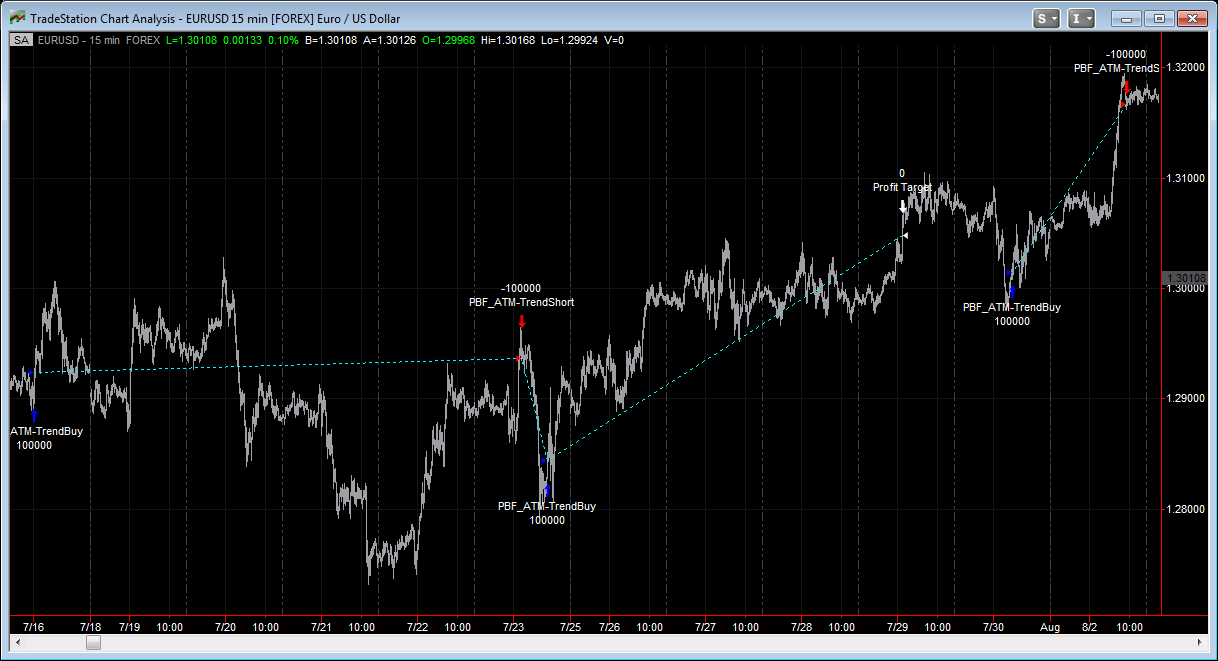
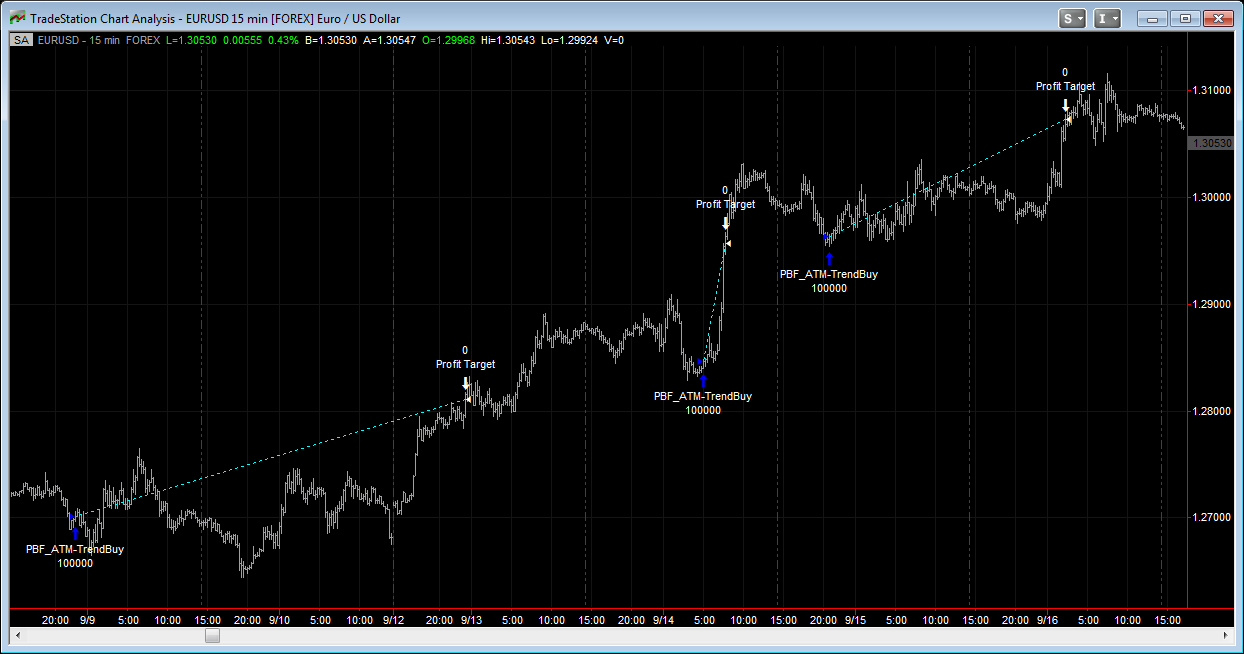
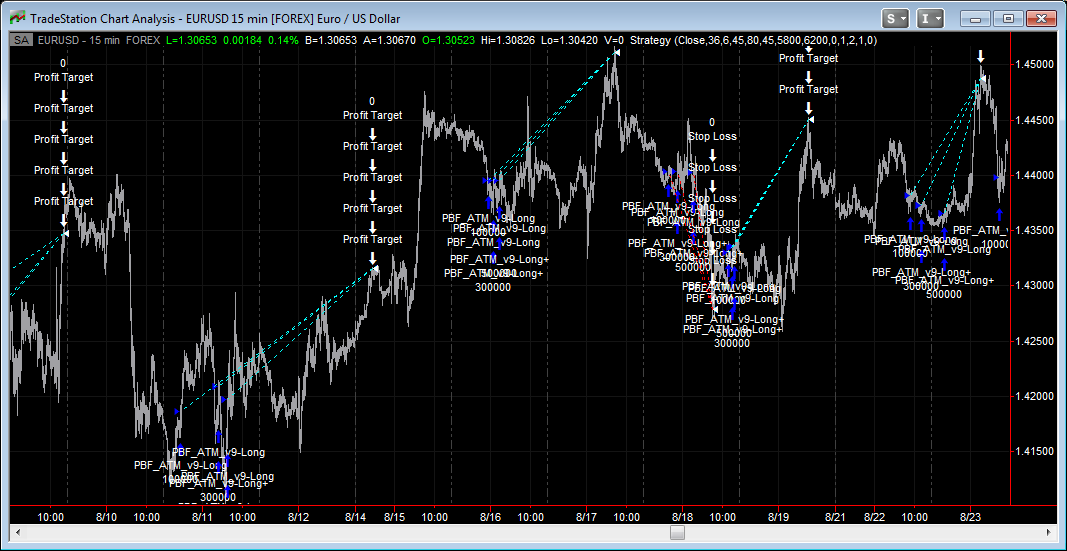
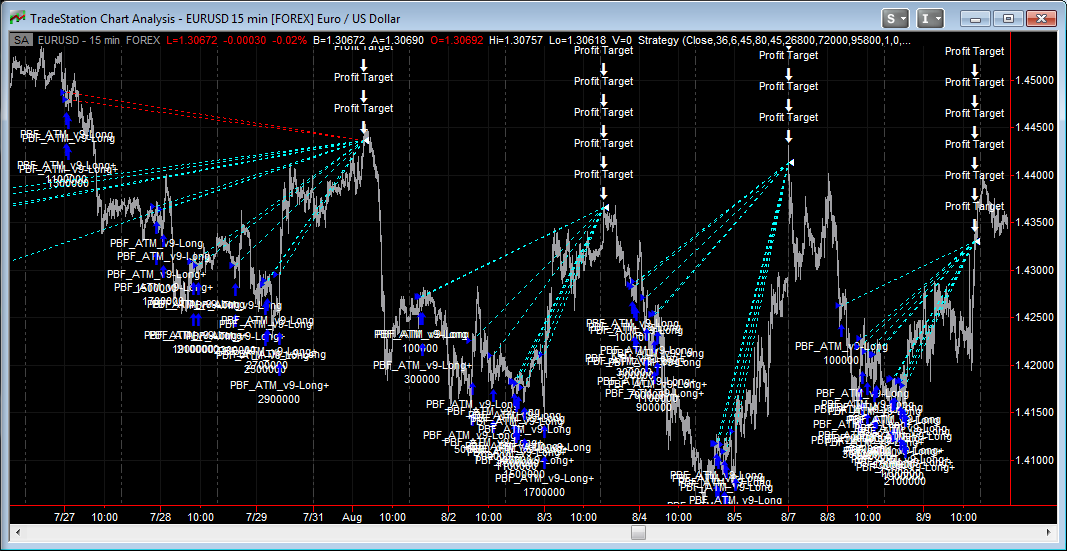
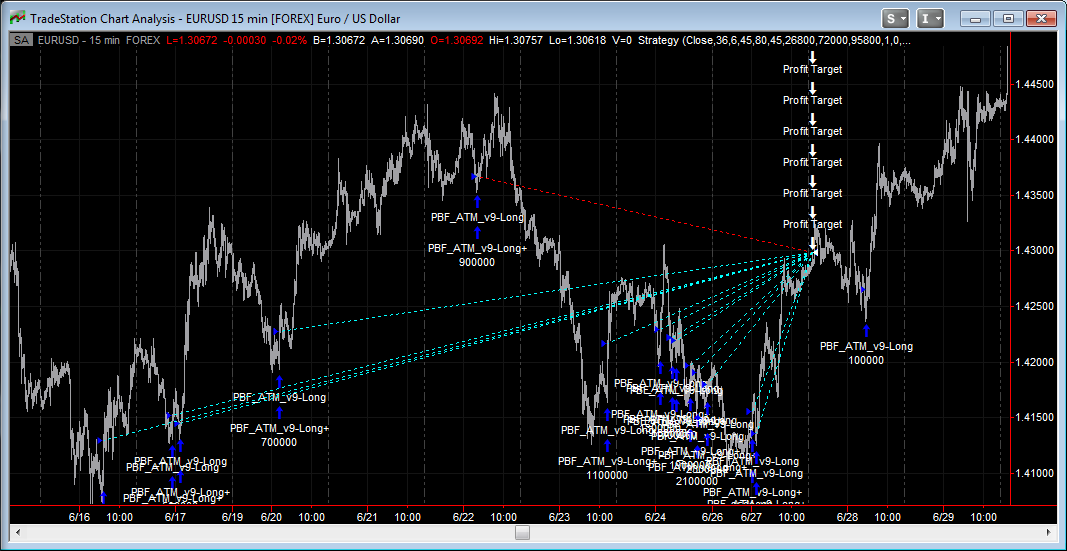
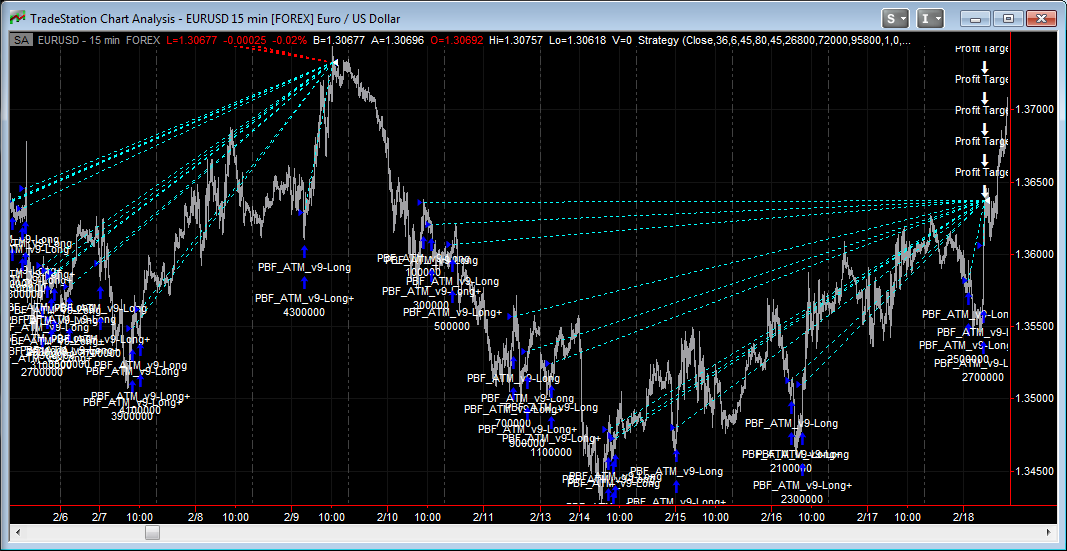
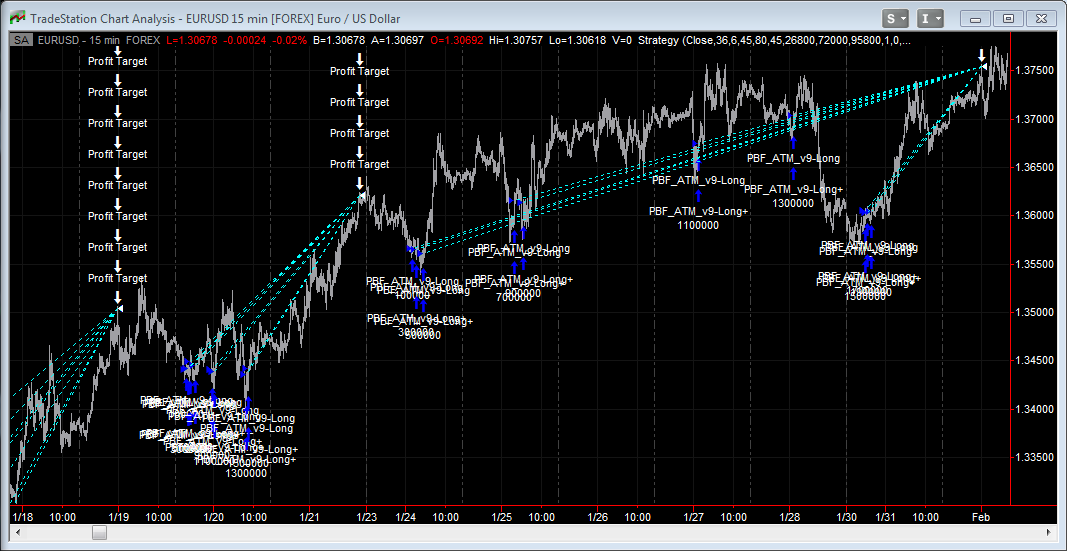
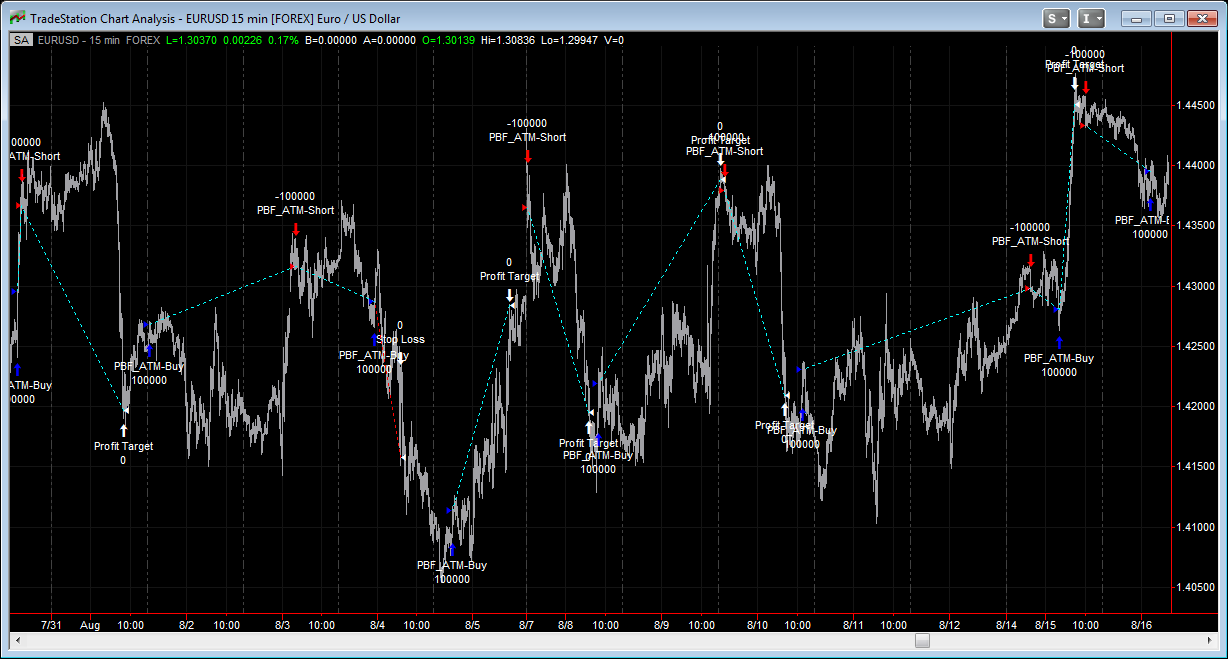
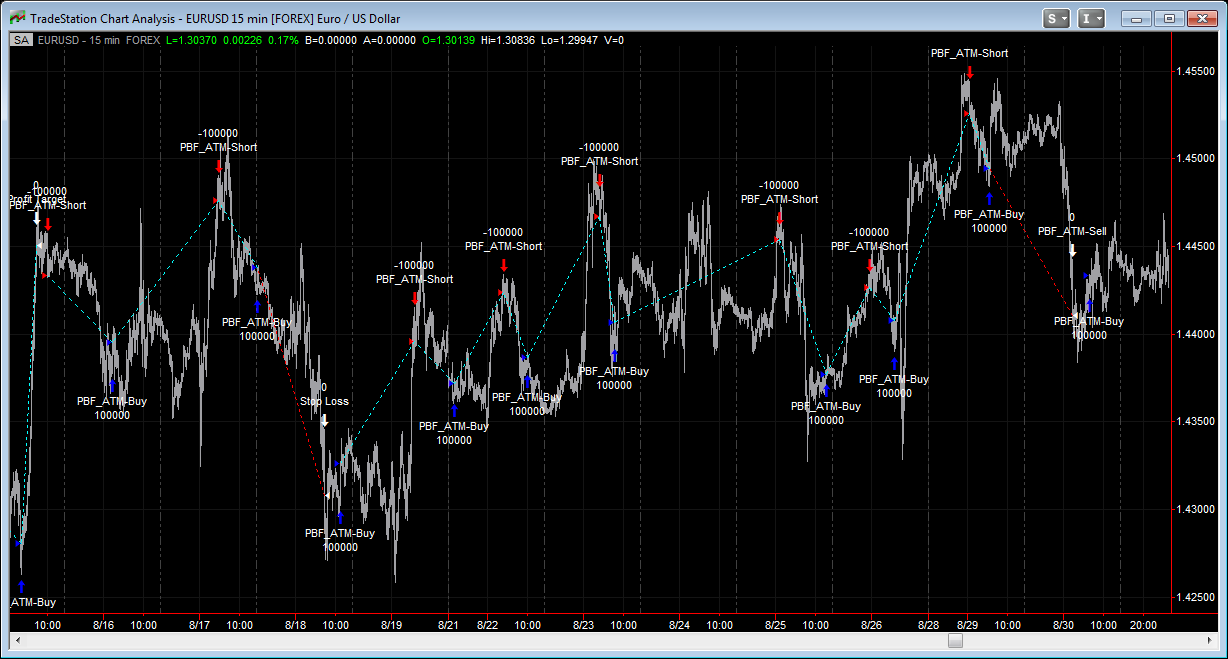
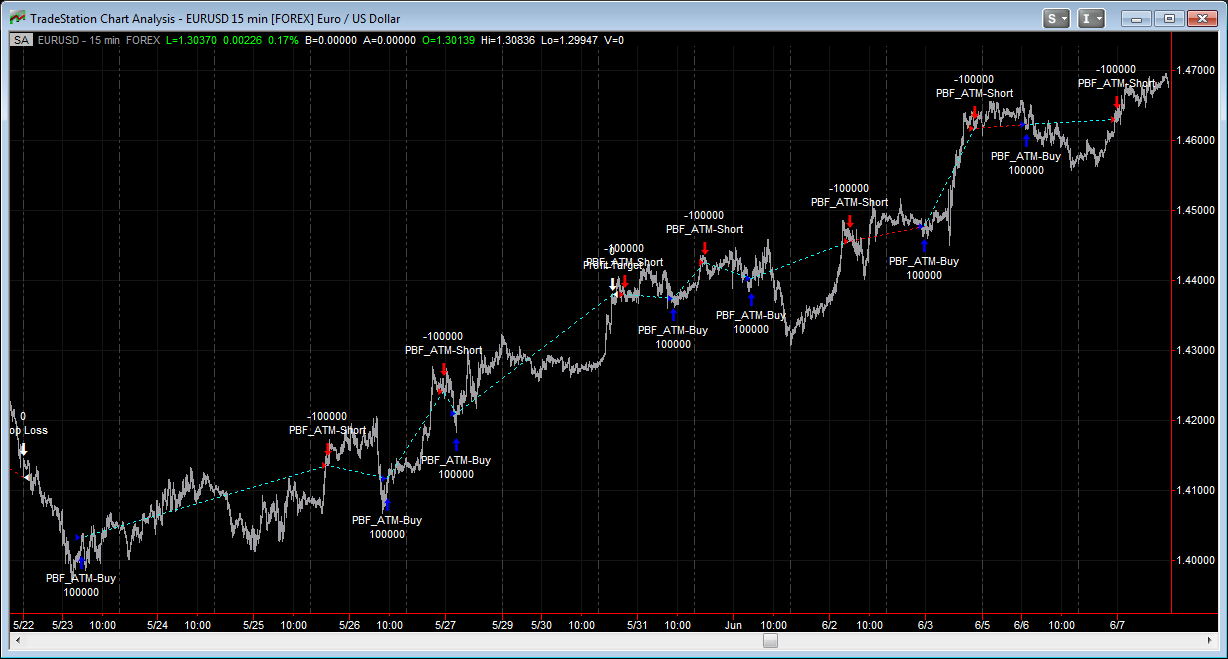
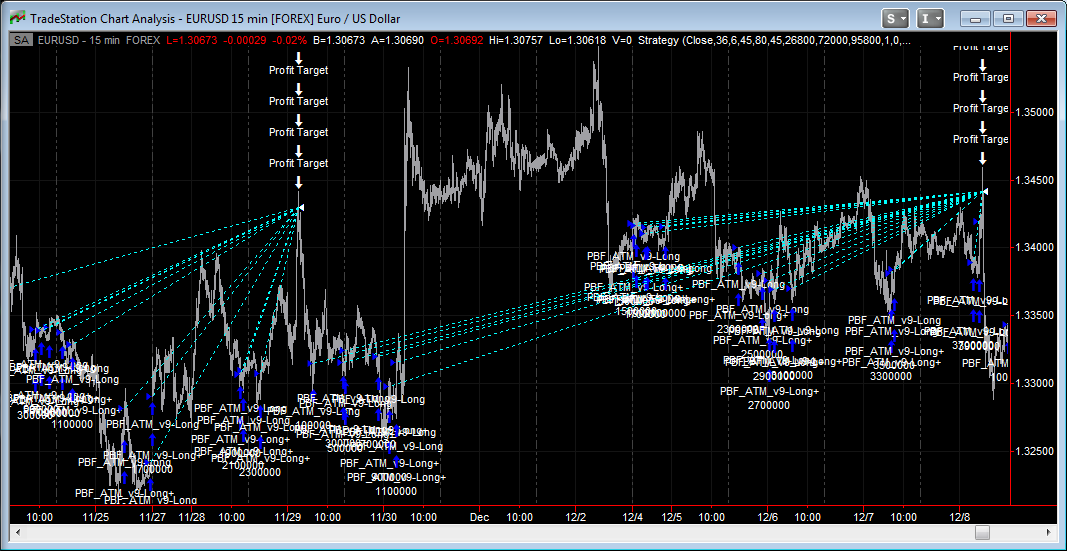
Below are two screen shots of the "PBF_Personal_ATM" strategy applied on EURUSD 15 minute time frame showing the entire month of August 2011. In this month, it executed 29 trades, made $15,711.60 trading 1 lot with a win rate of 86.21%. Slippage of $10 per trade is being deducted. Simply outstanding! Of course not every month is like this! In fact this was one of the best months in recent times. But when you have a month like this, it really helps the bottom line. And if you go to the PBF Tent Trading page, you will see that I made 44 trades on NDX alone (among other symbols) in August 2011 on my LIVE account without a single loser, and made $27,875 profit! (No wonder in late September I took a one-month vacation overseas...) August 2011 was a crazy month if you remember, the US credit rating was downgraded, the market fell 600+ points on a day, gain 300 points the next, etc. One of the most volatile months since October 2008. But October 2008 was "easier" because the market just fell off the cliff! August 2011 was quite choppy as you can see from the charts below!
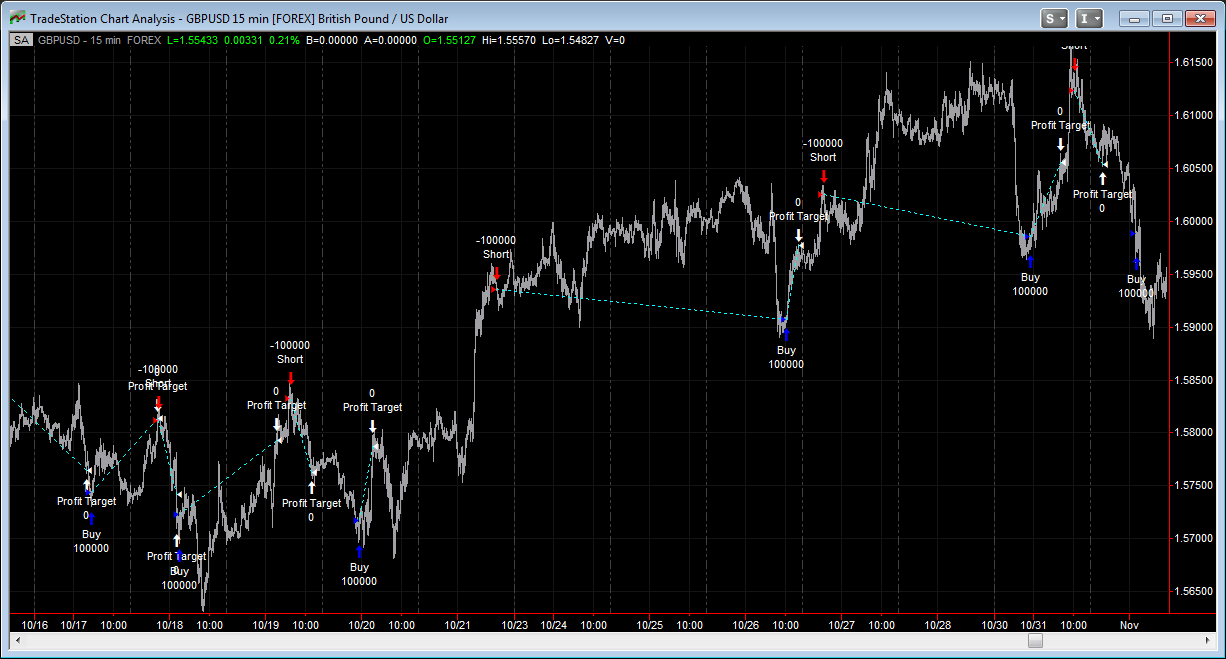
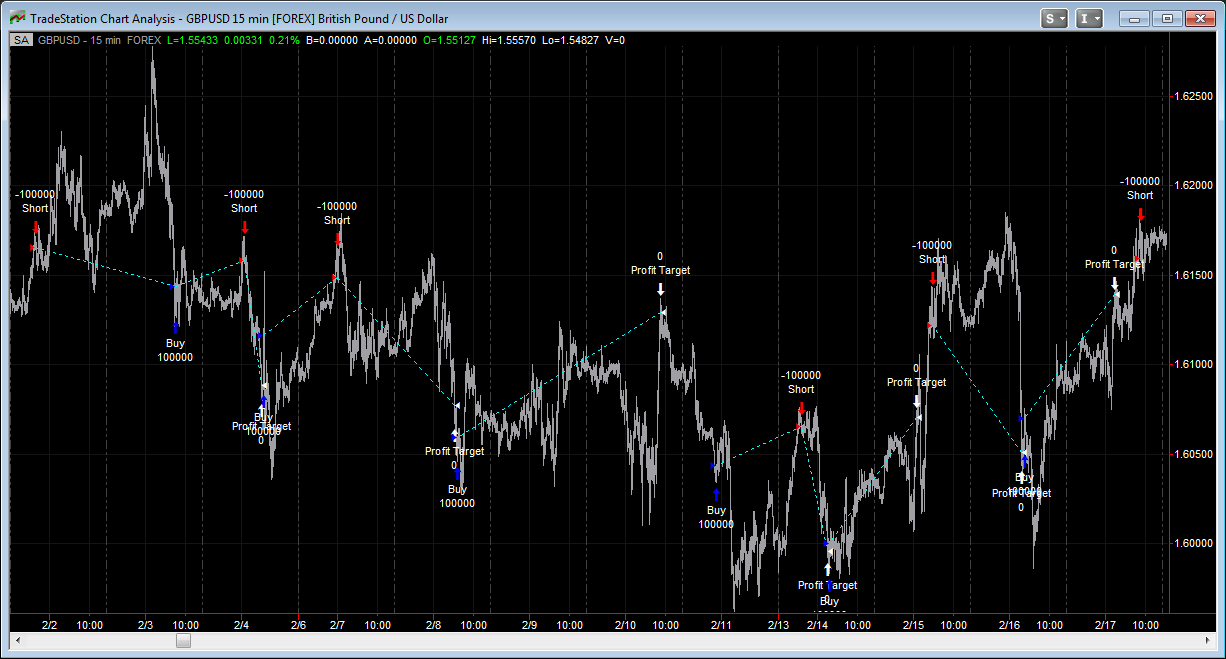
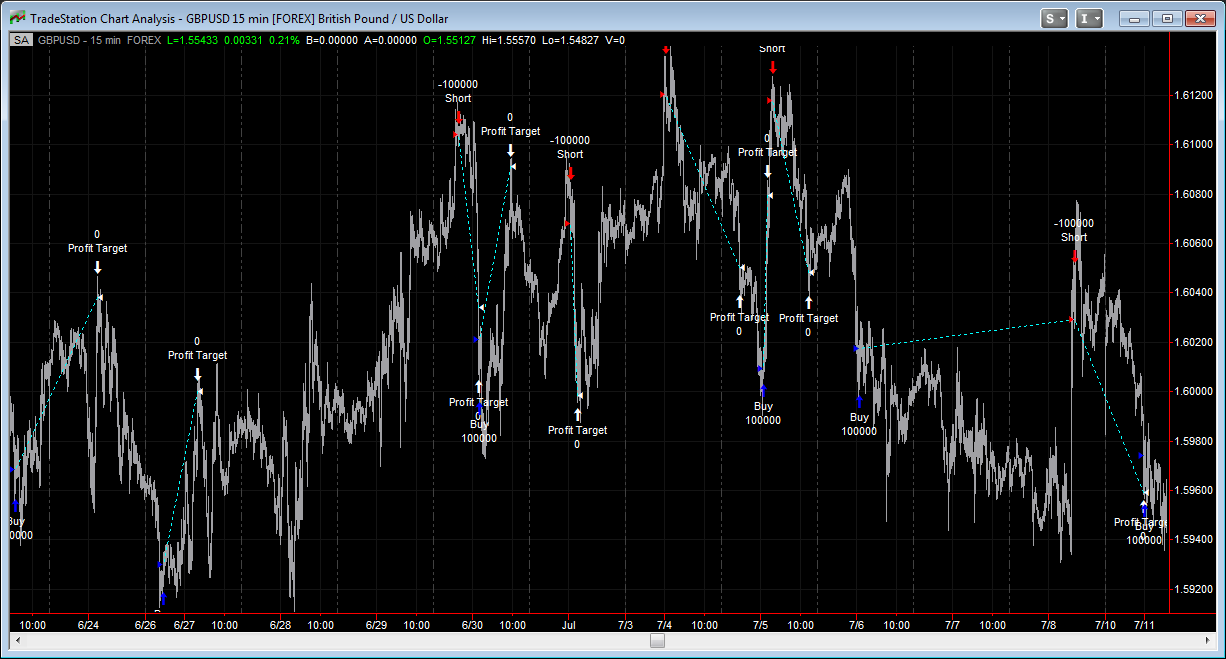
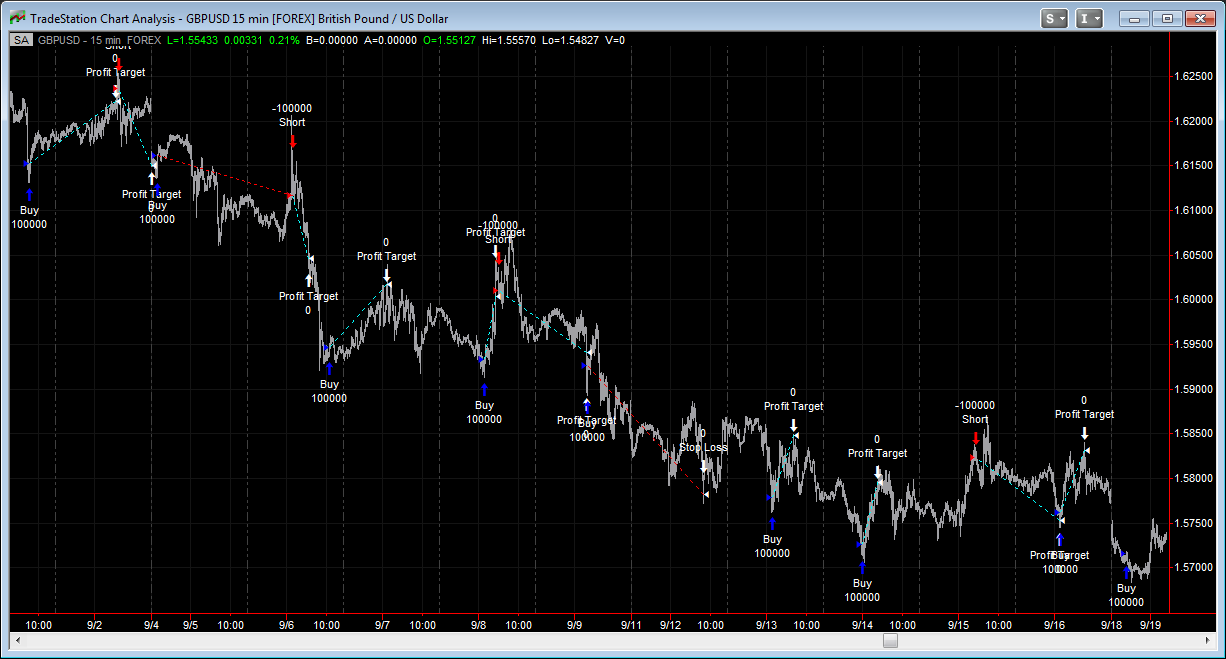
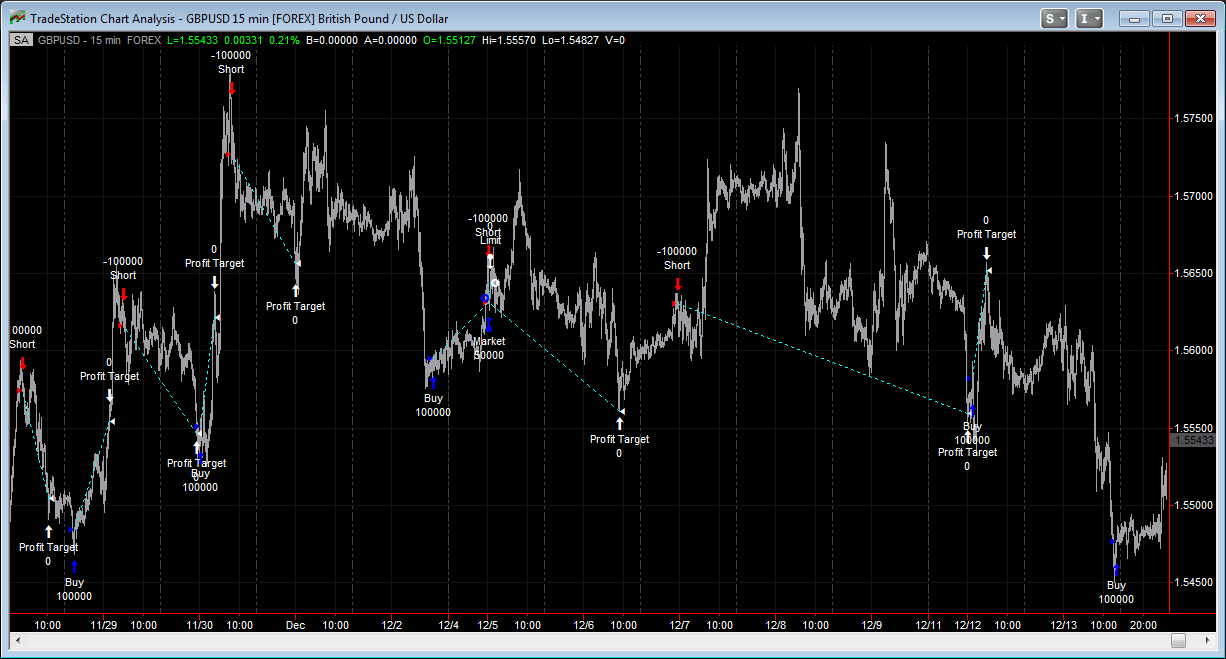
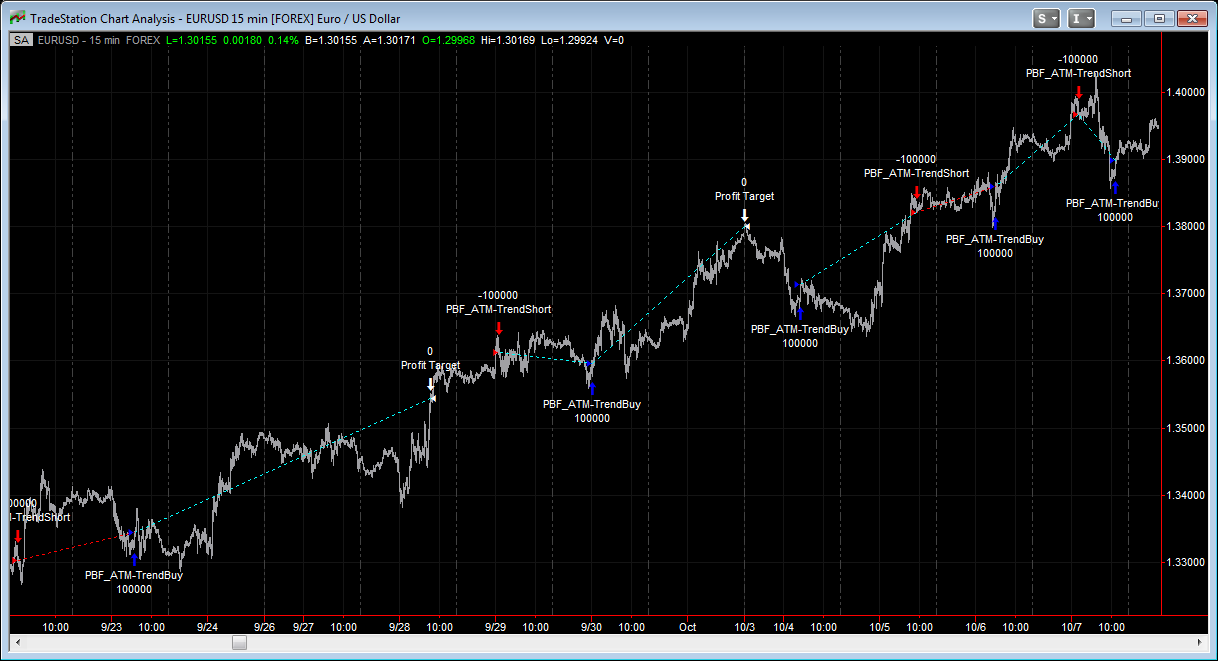
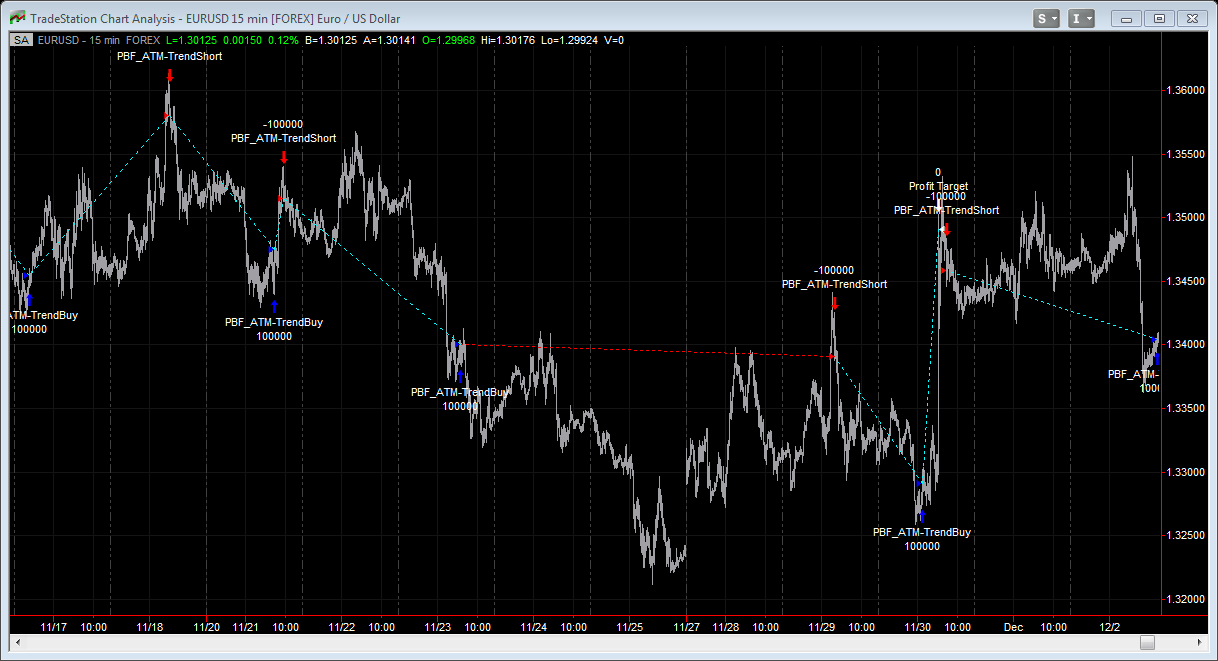
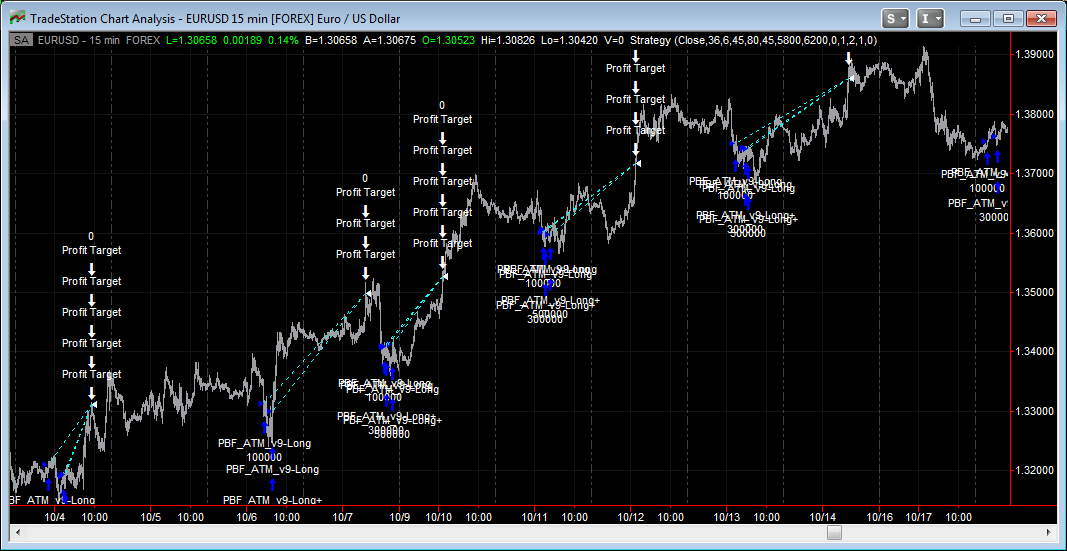
How about GBPUSD with the same strategy? How much difference will it perform? The best month in the past year was October. Let's take a look of the charts and the performance report, shall we?
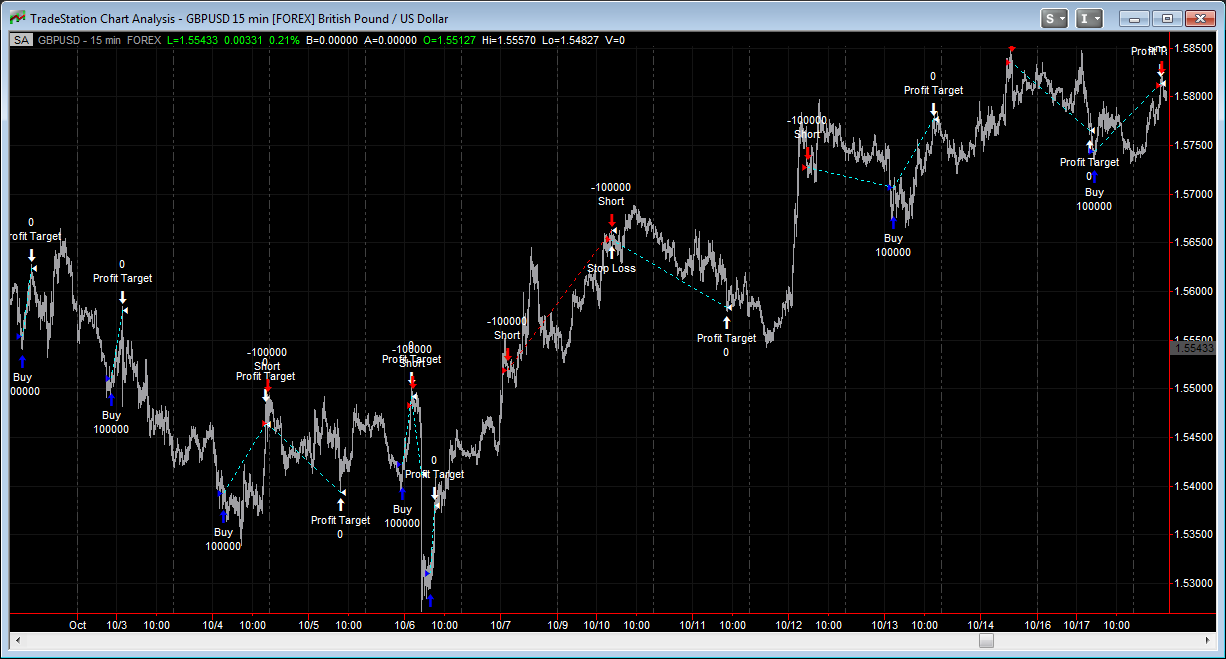
OBVIOUSLY, I am cherry picking the charts to show you here!!! If every month it performs like this, I could just sell this strategy to Goldman Sachs or even start a bidding war on Wall Street, selling it for millions or even billions of dollars (don't think it is impossible, Forex market is an almost-4-trillion-dollar-a-day market, remember that!) buy a small island and retire. But let's take a look how the other "worse" months it had performed.
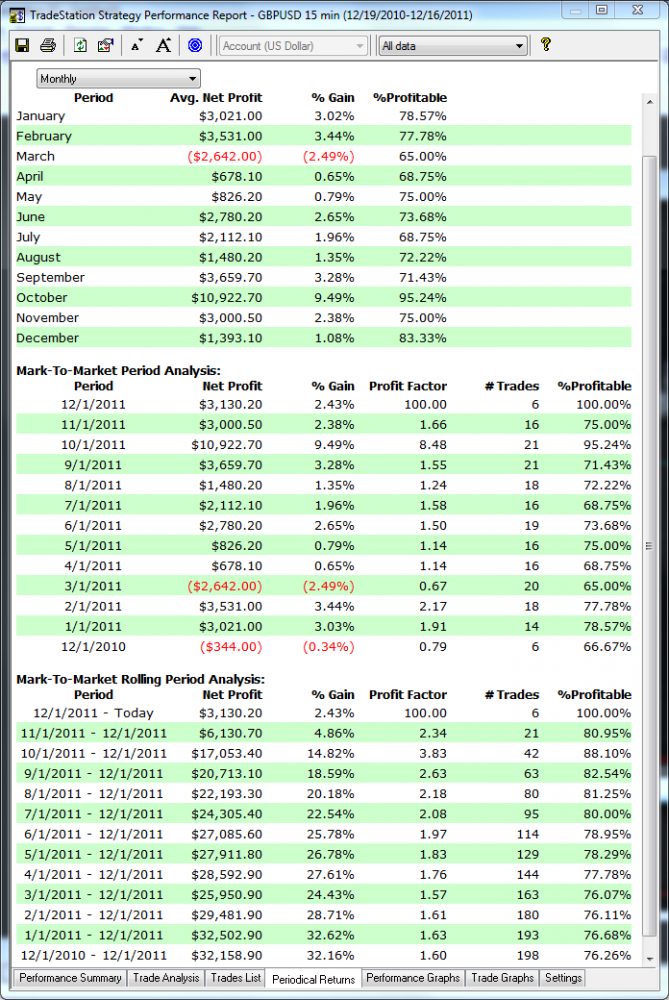
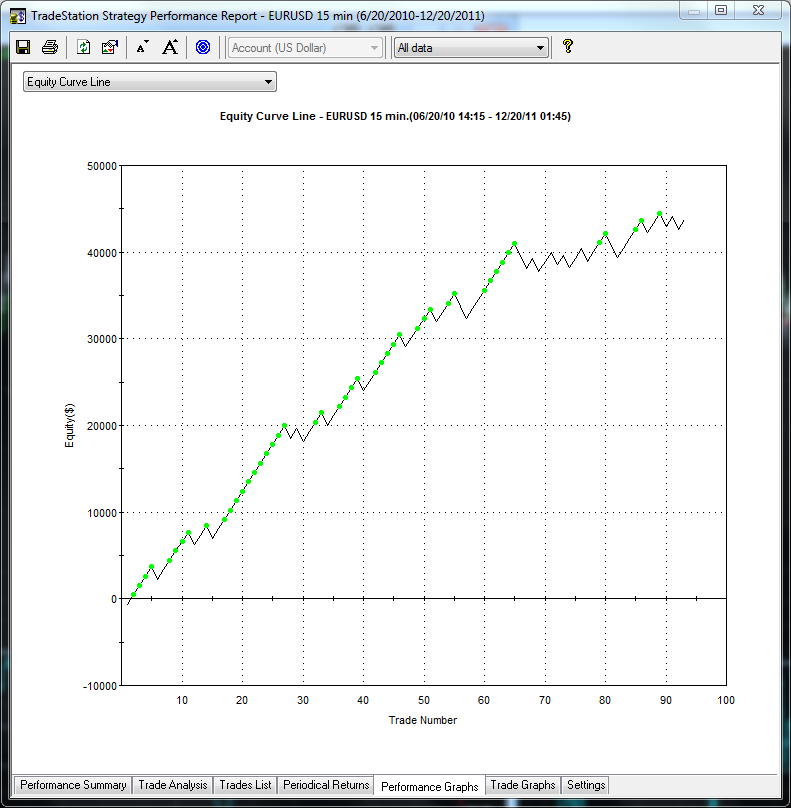
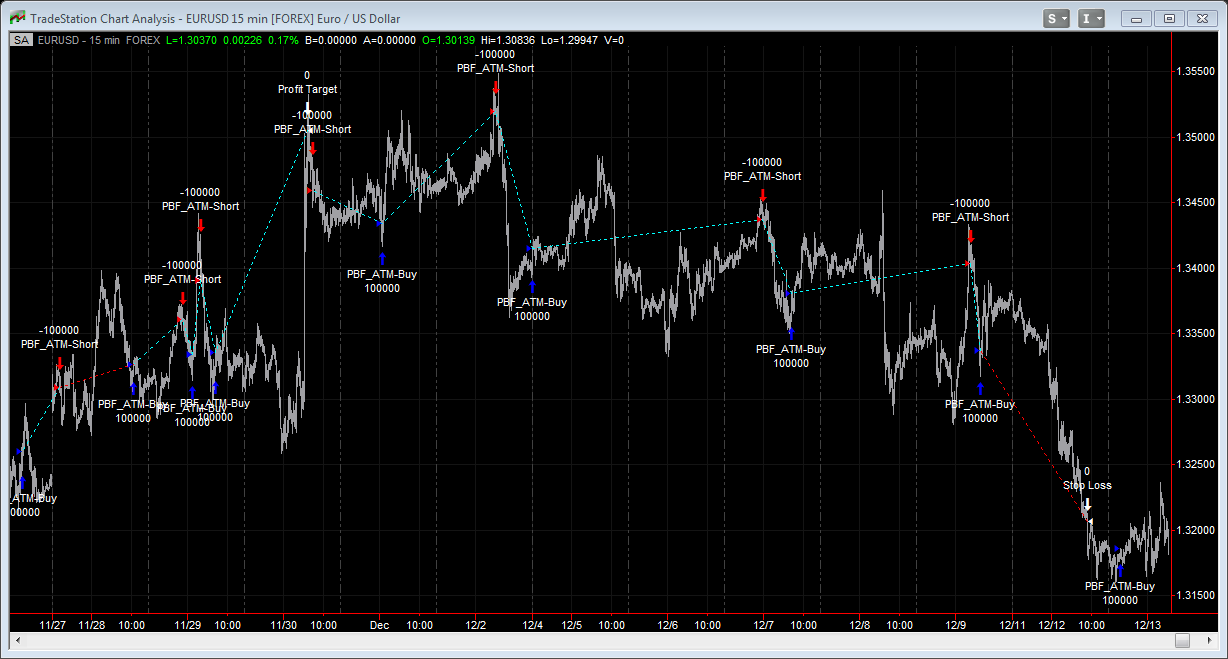
December 2010 was a losing month, but remember, it was the first month and the data might be incomplete. It wasn't an entire month, either, as the report starts from December 19th of 2011 until today, December 16th 2011. So without compounding or proper money management, it has managed to make $32,158.90 for the year on auto-pilot, trading just one lot, with $10 slippage deducted from each trade. The worst month it had a win rate of 65%. This month it made $3,130.20 with 6 trades, no loser, but of course this month is not over yet. It actually performed much better in the recent 6 months than the last. Good sign!! And to be honest, this isn't the best setting to trade. Never use the best setting from your back testing result when you go live, because it could be "out of sample" and got lucky a few times in the past, doesn't mean it will get lucky again in the future, especially if the best result is head and shoulder above the rest. If that's the case, it is not realistic. That's my free advice to you!
Another important factor to consider is the drawdown. Don't be fooled by those high win rate systems, they can NEVER work. The reason they can win 90%+ of the time is because their target is very small, going for only a few pips as their target, so it is easier to achieve. But 1. Usually they don't take the spread/slippage into account in their reports. 1 pip is insignificant if your target is much larger, but it is 20% of a 5-pip target. Take off 1 pip from each and every trade the high win rate systems make, from both winnes and losers, and see if it is stll profitable. Most likely it is not. 2. Their stop is usually very large, or no stop at all. This means you can win 20 times in a row making 5 pips at a time, but one big loss of 100+ pips will wipe you out. So if you win 95 trades out of every 100 with 5 pips profit each, lose only 5% of the time but the loss is 100 pips each, you are still behind. Not only that, 3. Can you really tolerate the drawdown when you see a trade going against you for 99 pips only to see the market magically reverse and make you 5 pips of profit every time? I know I can't. It is way too stressful for any one to handle. That's how the scam artists are trying to fool you with their outrageous high win rate. Win rate really doesn't mean a whole lot in automated trading really. There are other more important numbers to look at.
Back in 2007 or 2008, I was commissioned to code an automated system for $1.7 million dollars. My friend, who is a professional in Chicago, told me "Don't sell yourself short" while we were having an expensive dinner at a Japanese restaurant near Thinkorswim. It didn't matter because I was very skeptical of any automated systems, even with my own creations. If you read that part about automated strategies on the home page which I wrote a few years ago, you will see what I mean. I truly believe that human can beat the machine in trading, it's one of the few things we can actually do better than the machines.
However, now, at the end of 2011, I begin to change my mind. I still firmly believe manual trading can beat any automated systems, however, there are things computer will do better: It can watch and trade many pairs at the same time, while I can watch 3-4 markets at one time at most, and computers don't need to sleep, whereas I do take naps from time to time. So if the machines can achieve half of the results compare to my manual trading (actually it is better than that, but I like to be conservative when count numbers), it can fully make it up by trading more markets and more time. It can trade the forex markets 24 hours a day, 5 days a week, on as many pairs as I care to assign it to, which no human can do.
Don't ask me to sell this to you. It is not going to happen. I would be an idiot if I sell it to you for $100,000 or what not. If you code this, would you really list it on eBay and sell for $97? Or $5,000? $10,000? I think not. So don't waste your time, or mine, asking that question. I will not answer. I know how some people are really skeptical and hate the "vendors" because they were lied to so many times. But there are a few good guys out there whose reputations are really killed by those con artists. However it is not my fault that you can't tell the good ones from the bad. I have been lied to so many times in my trading career, especially when I first started. I NEVER blame any of them. It was all my fault. But maybe not. Because I still managed to learn something out of these experiences, if not "what to do", at least "what to avoid". If I stopped investing money on my education after being scammed a couple of times, I would never have known what I know today, that's a simple fact. So in retrospective, it is still all worth it. But I know there are haters out there who just don't believe that anything can work. My question to them is, why don't you get a job and give up trading all together then? What are you still looking for if you are so certain nothing works and everything about trading is just a lie? Go wait tables or drive taxi or do dishes, at least you will get paid for your time, as opposed to staring at your charts for hours at a time, and still lose money to the market.
Not sure what got into me tonight! Another page is born for this website. I am glad that I finally "did it" after all these years. But I do believe this still has room to improve. I could possibly make it better. I still have one or two more ideas I want to test. Don't get me wrong, I am still skeptical, but I finally have something that somewhat convinces me to a certain degree. That's rare. Let's see what it brings in 2012!! Thanks for reading!
More Examples:
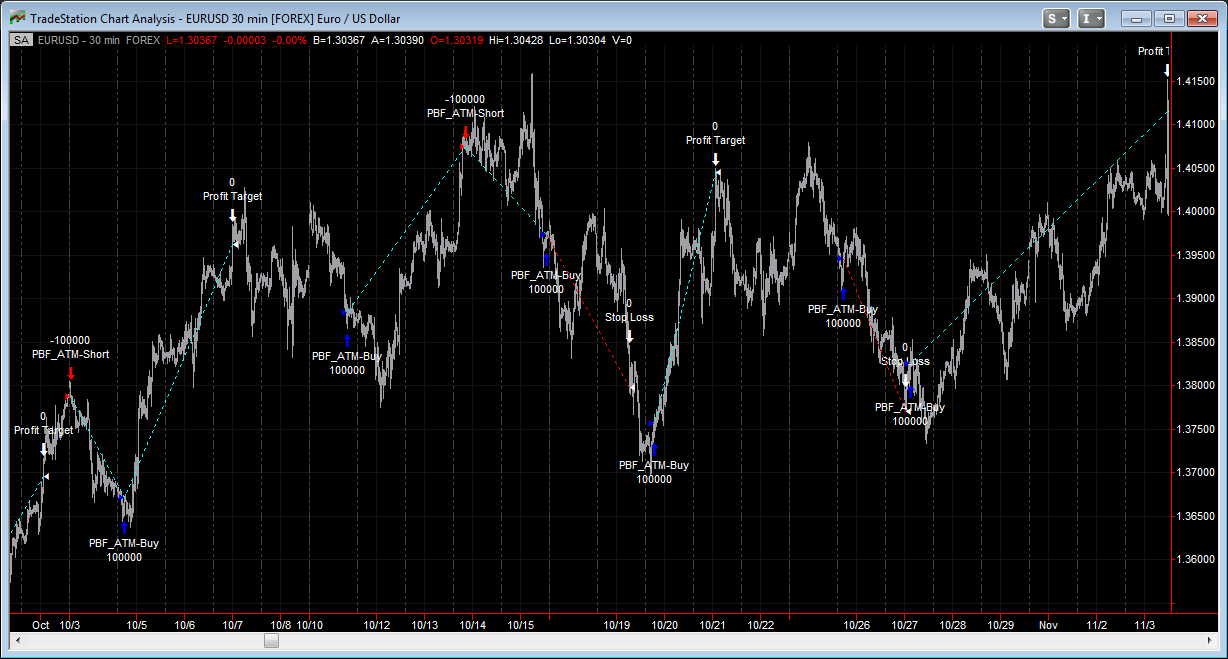
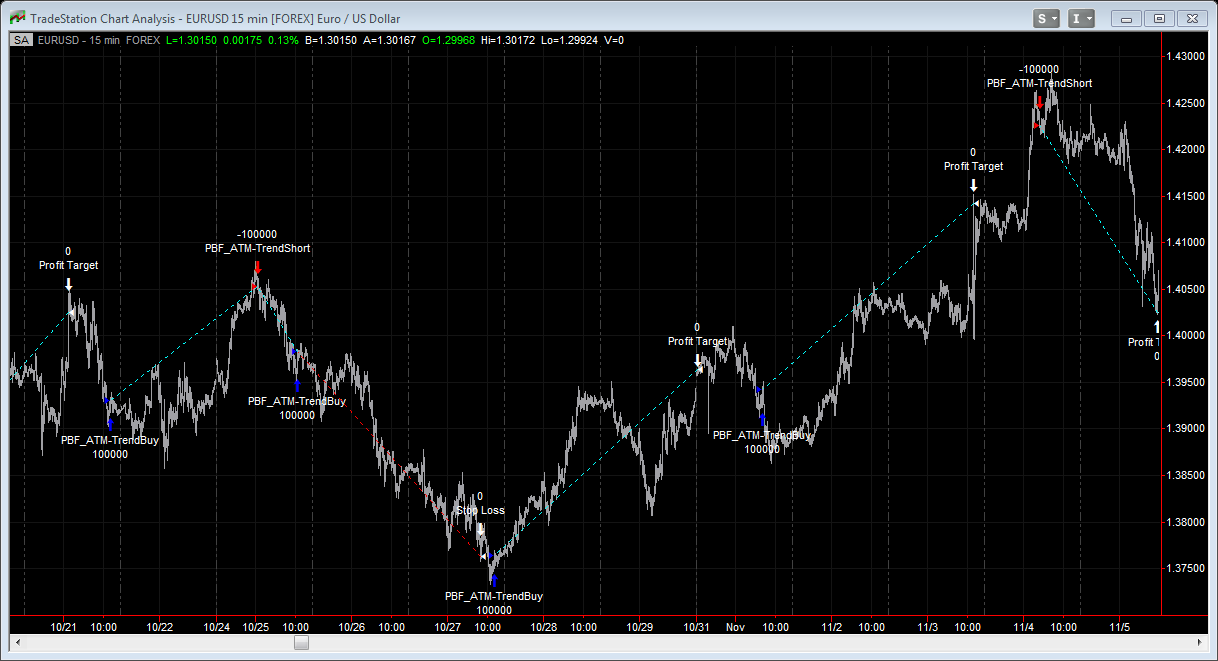
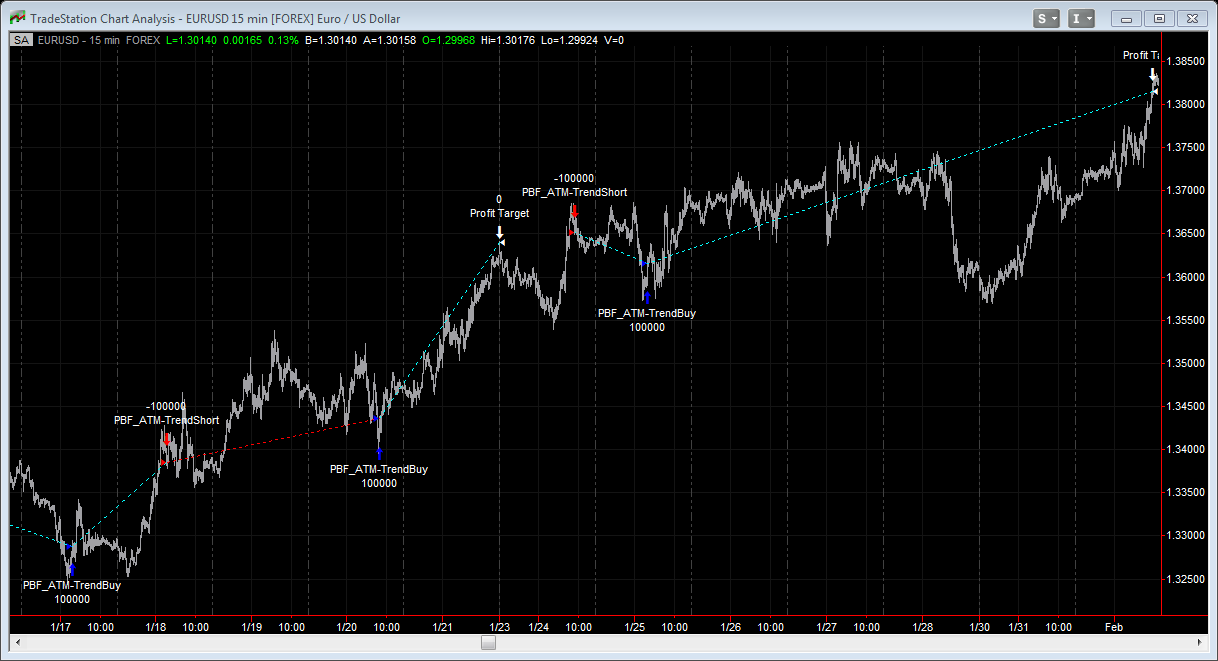
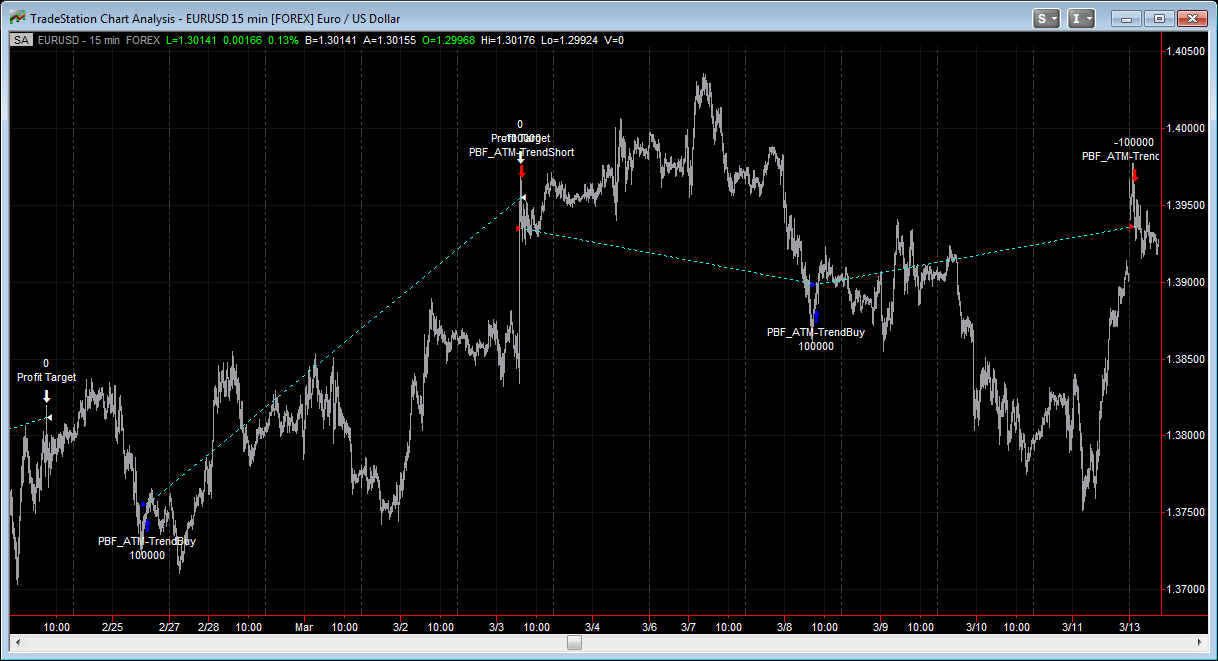
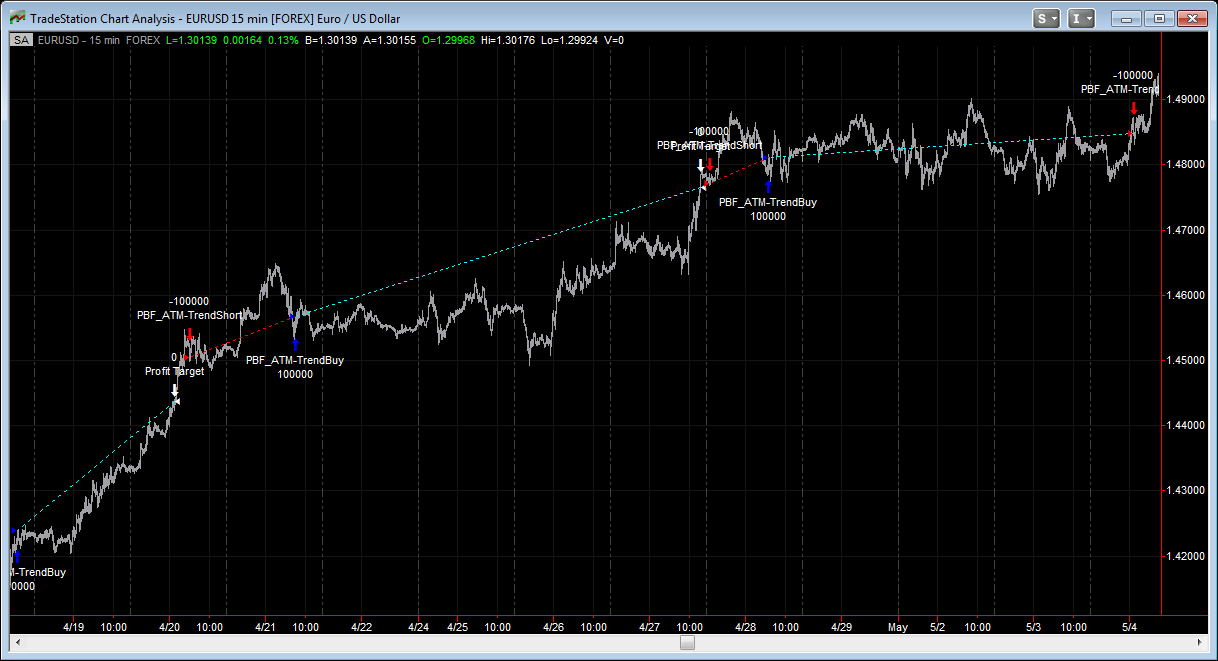
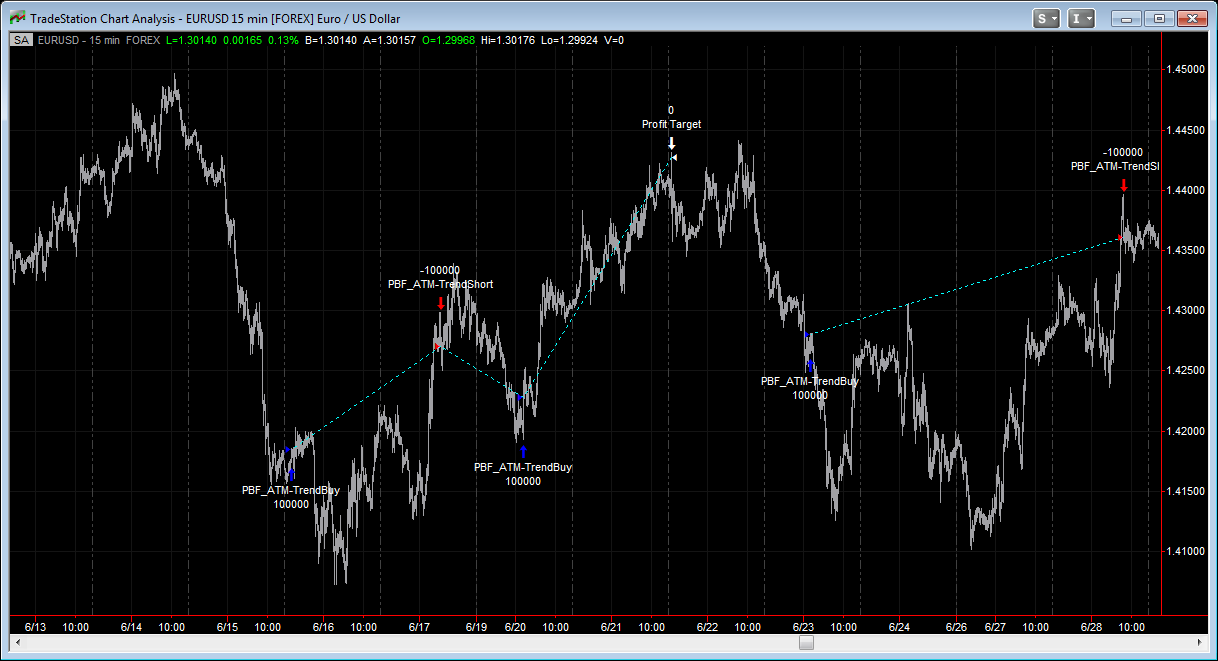
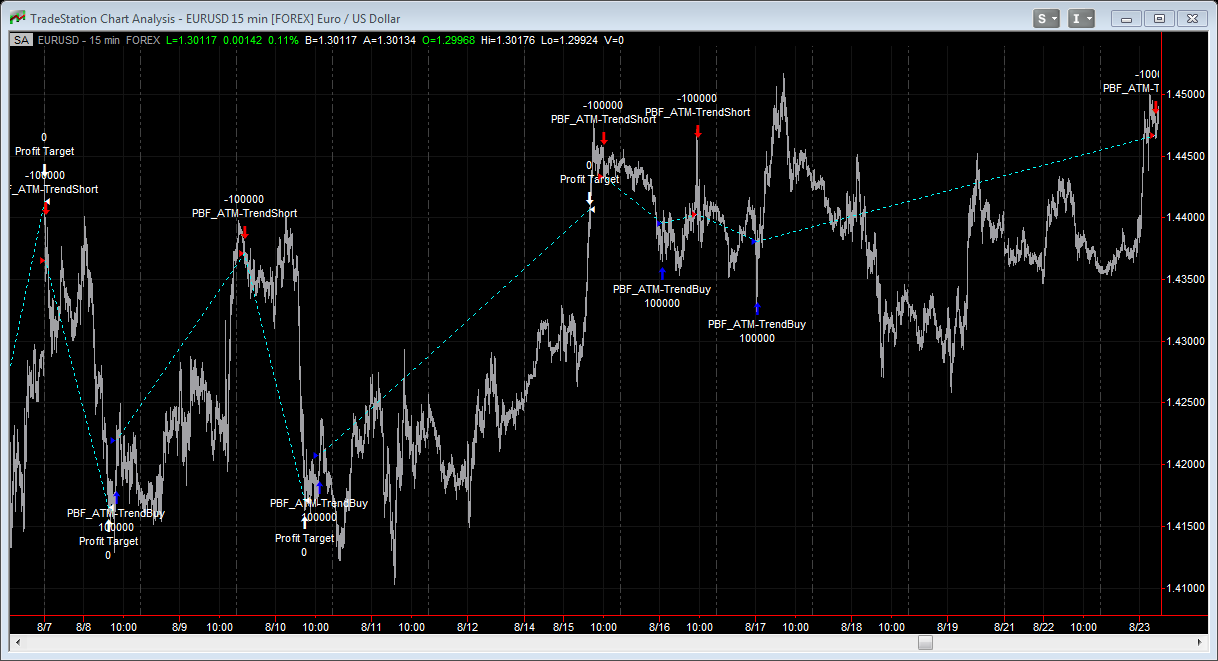
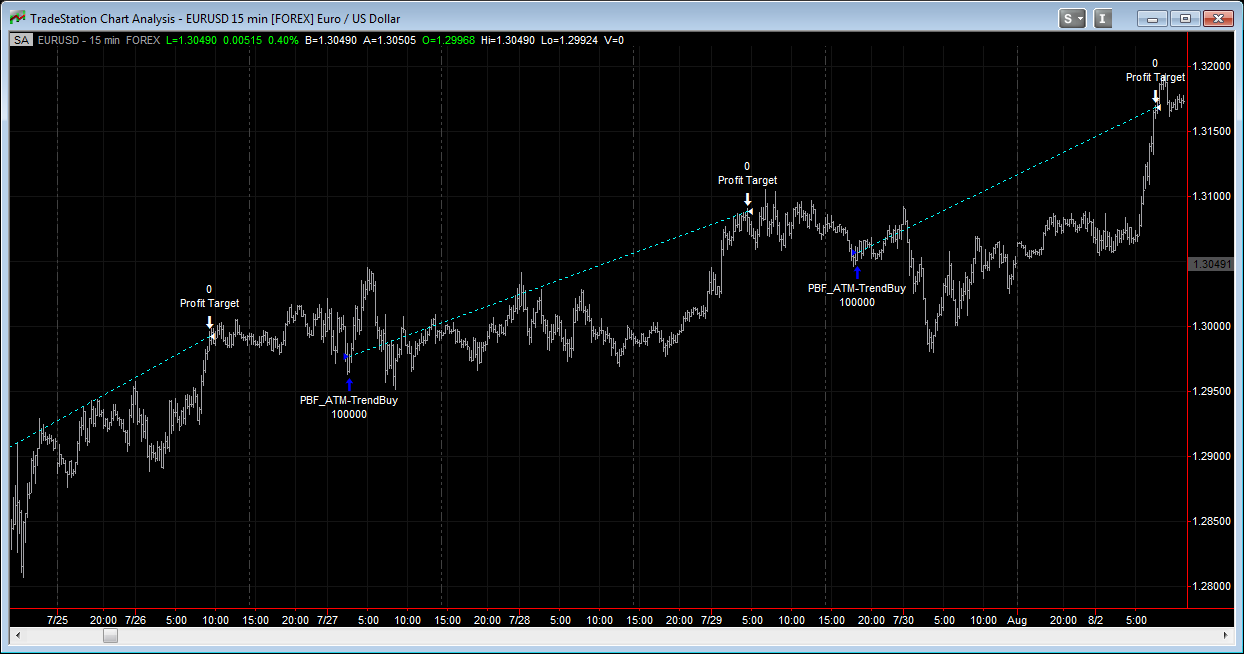
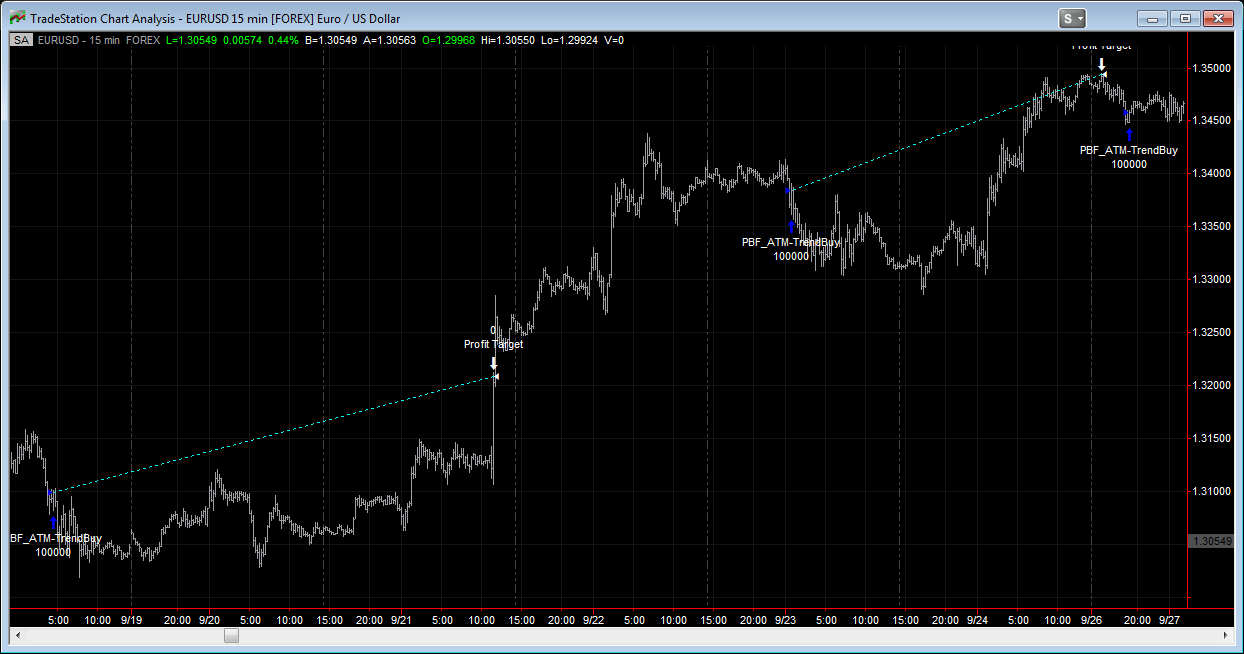
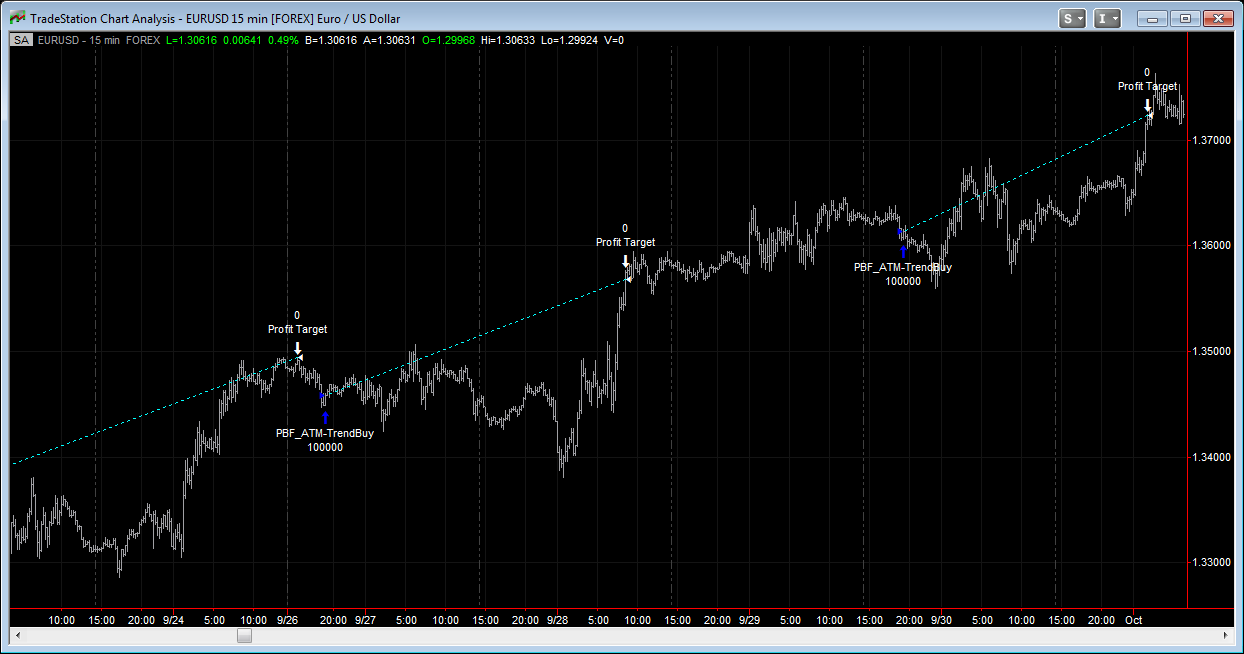
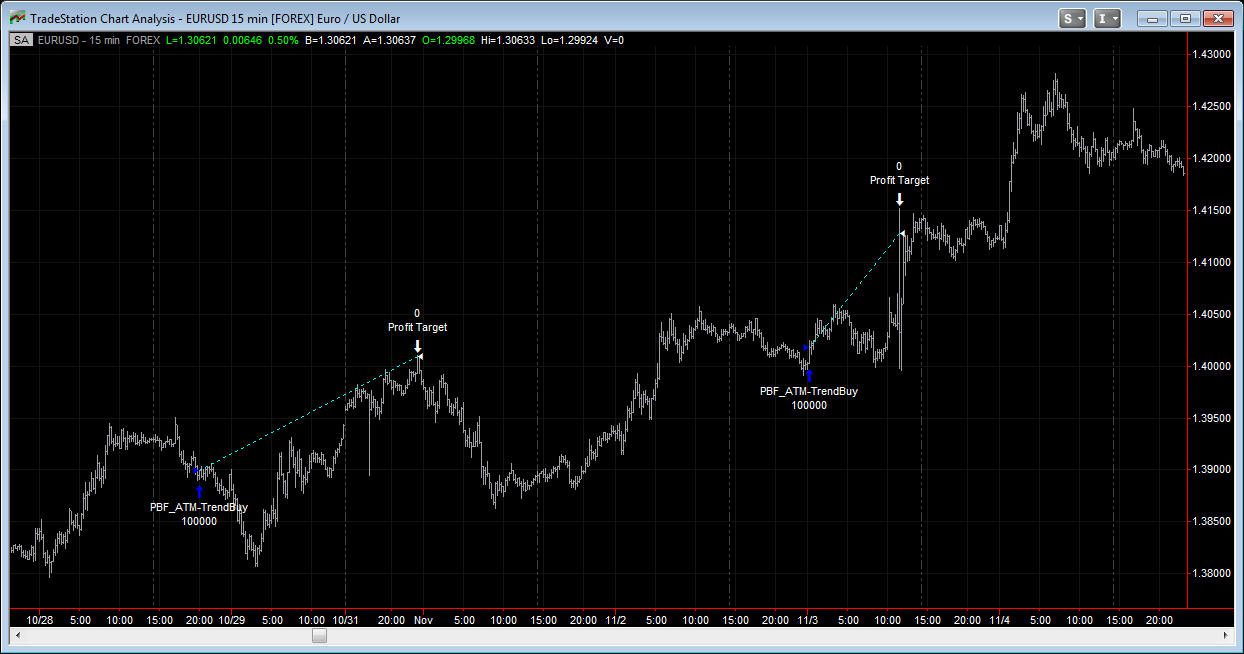
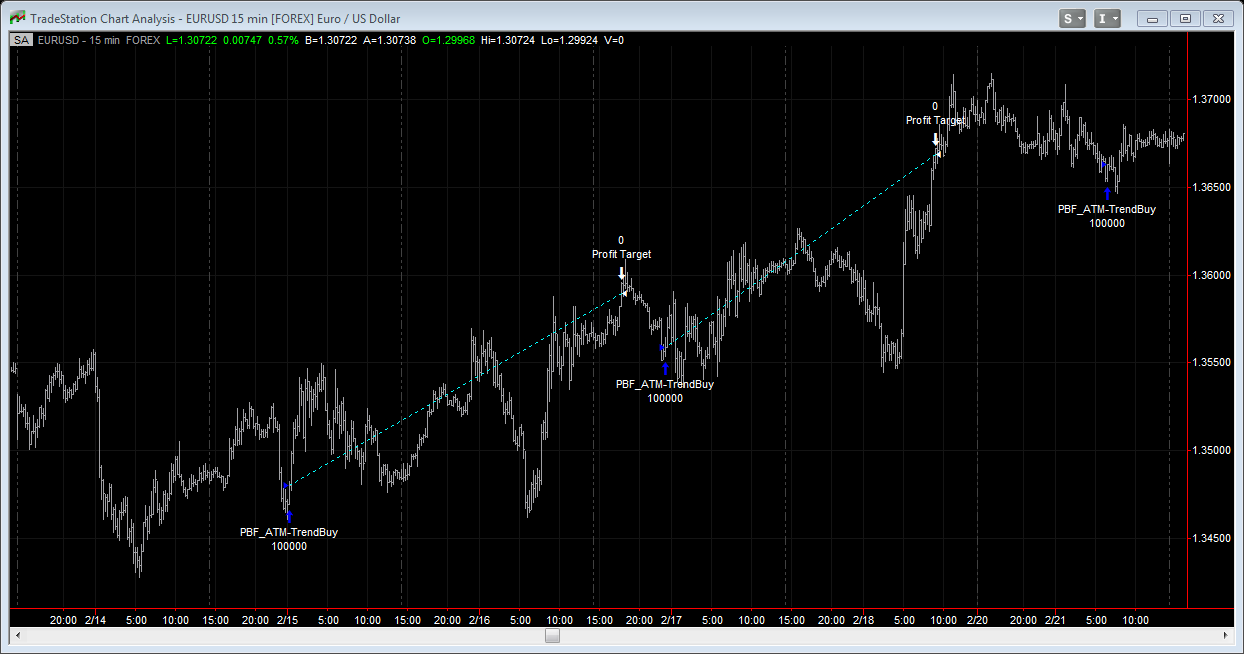
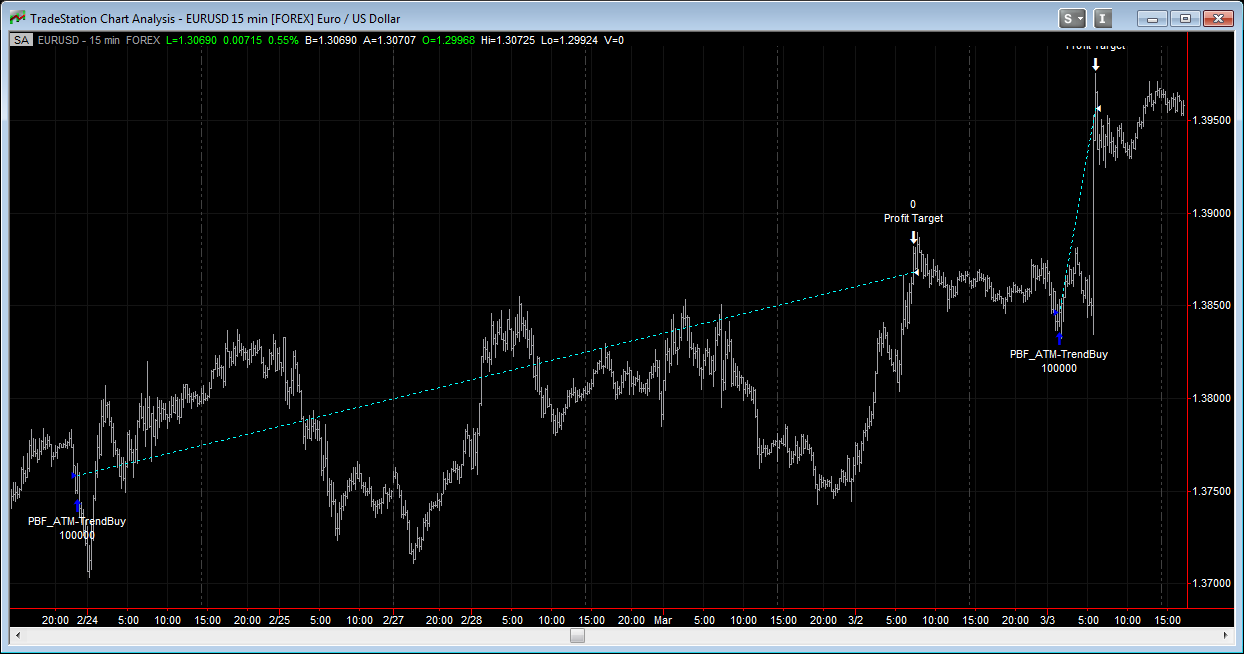
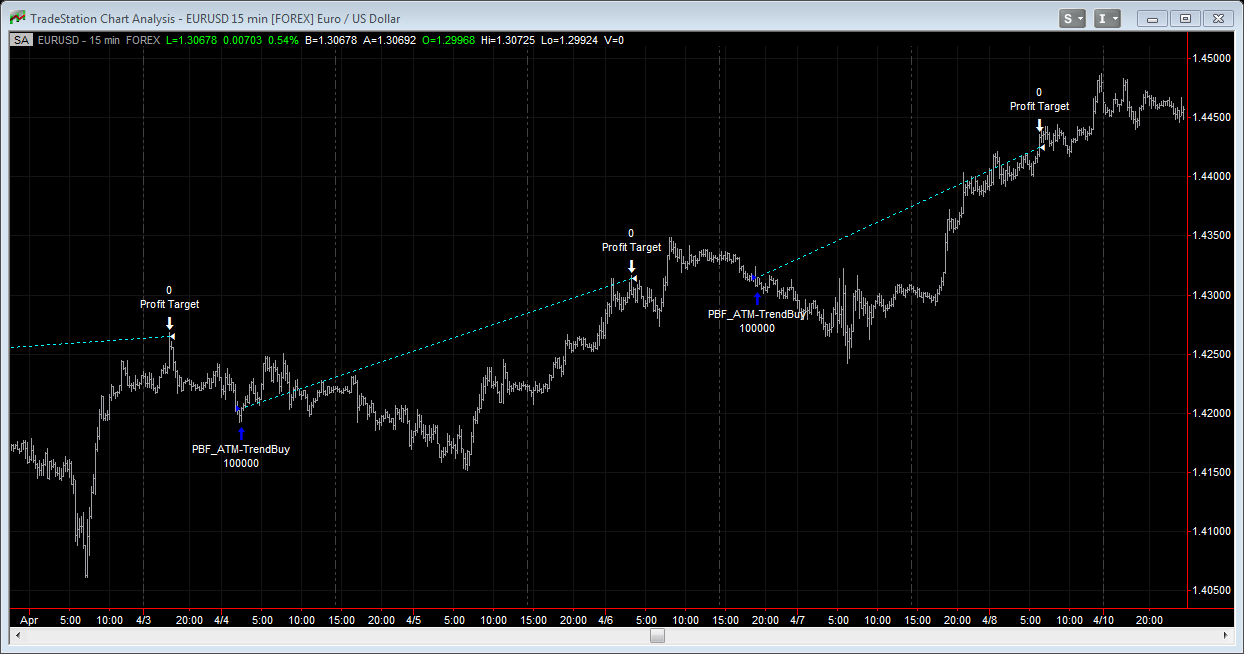
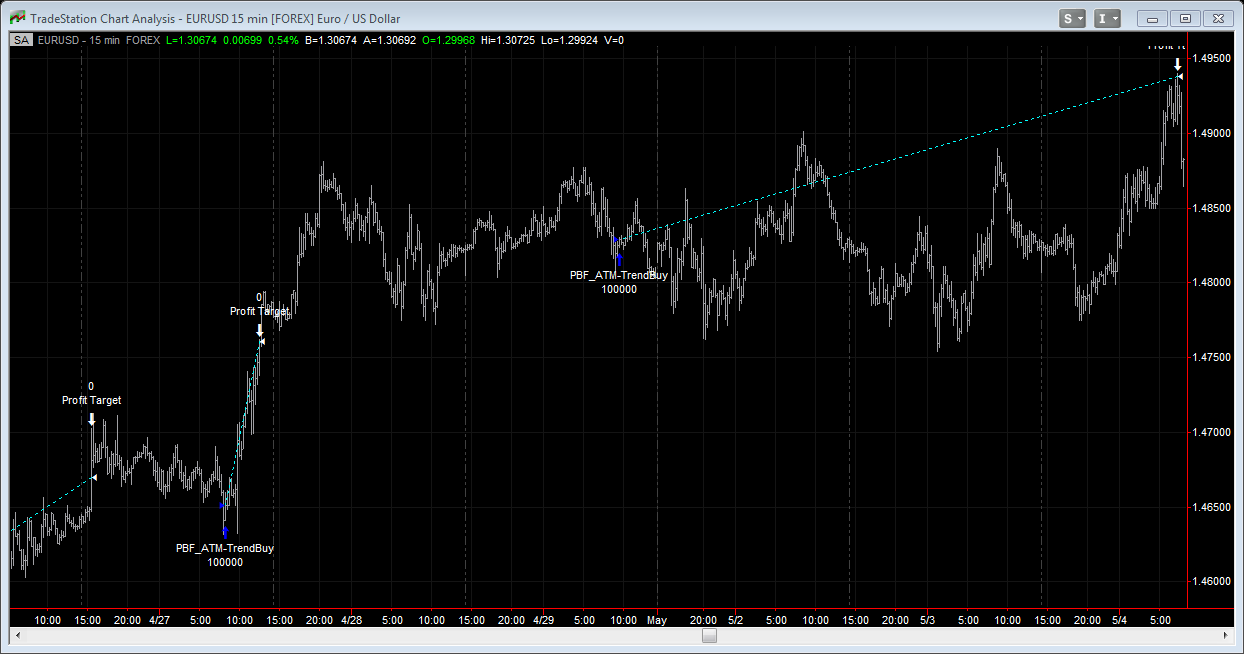
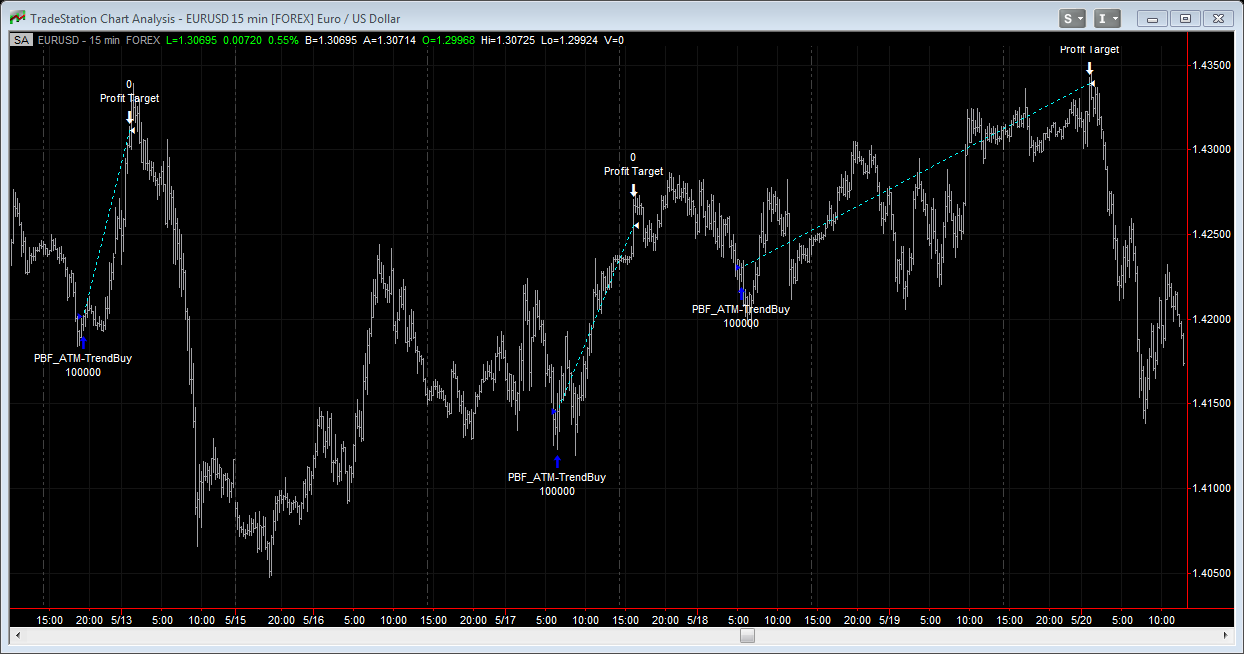
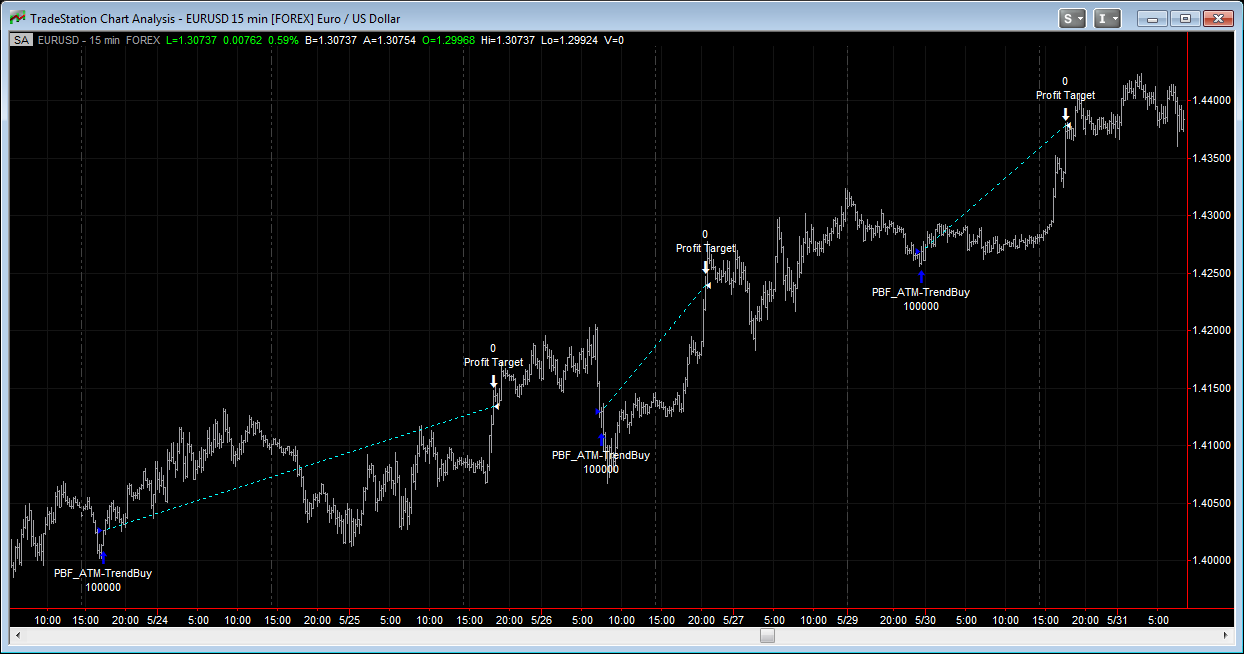
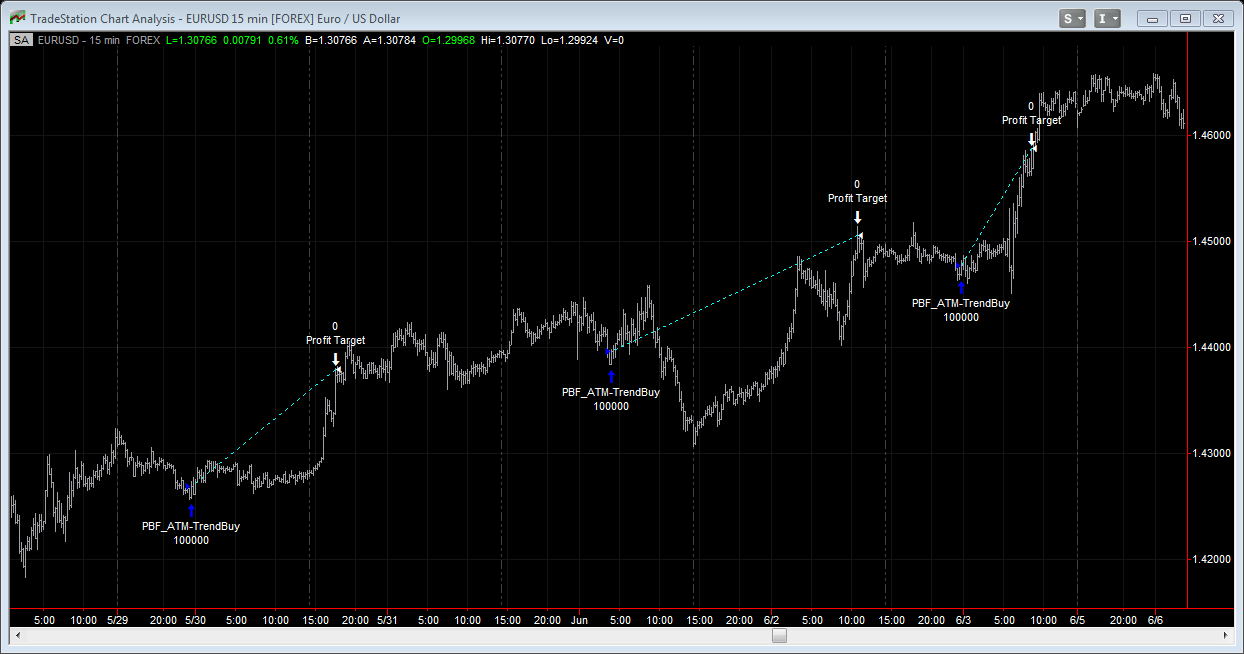
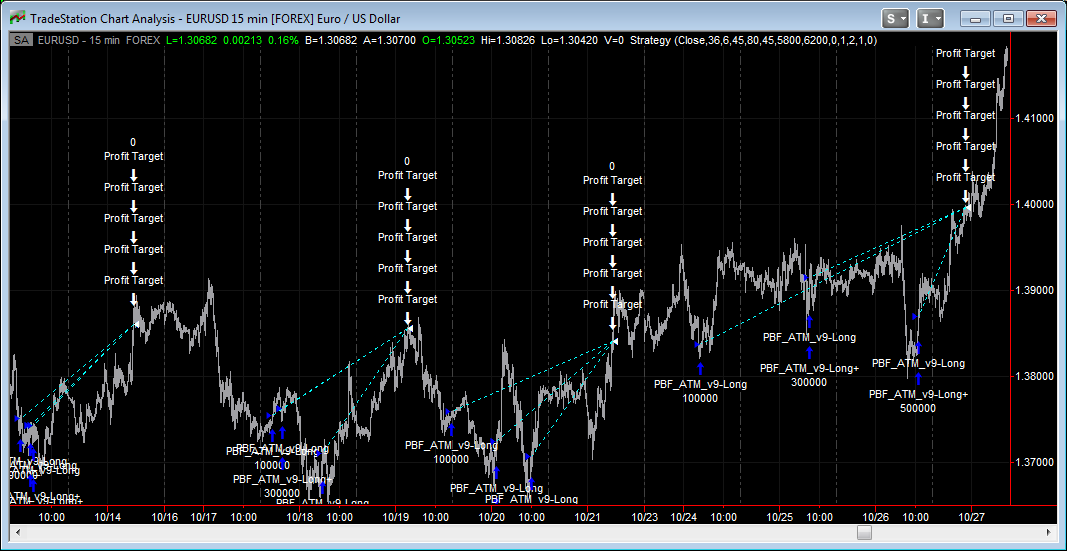
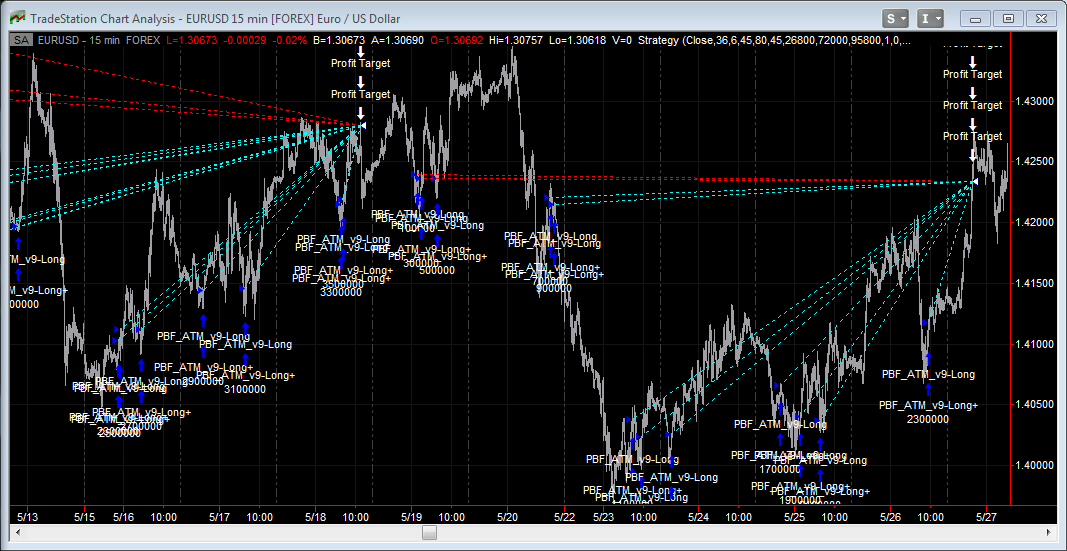
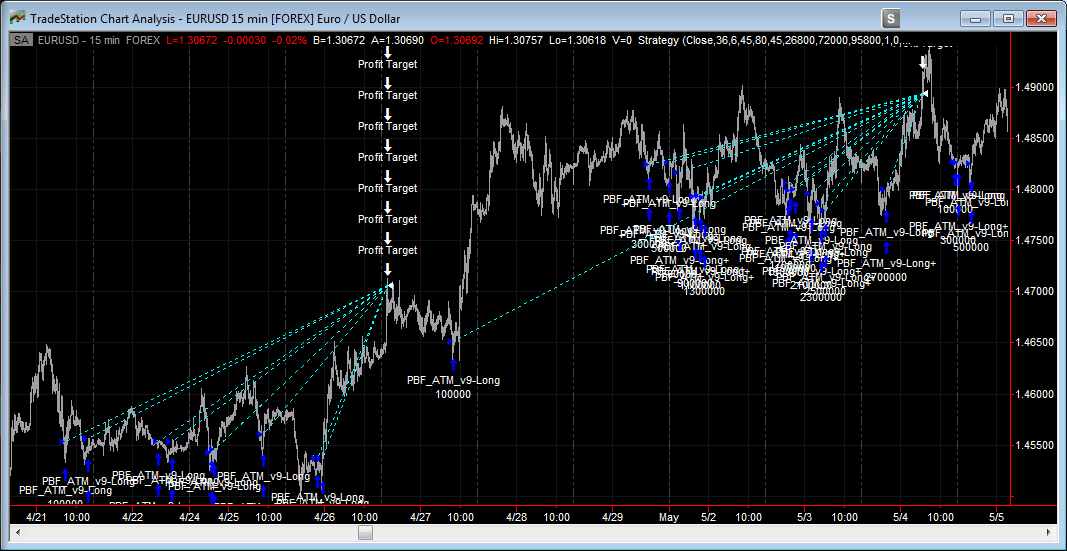
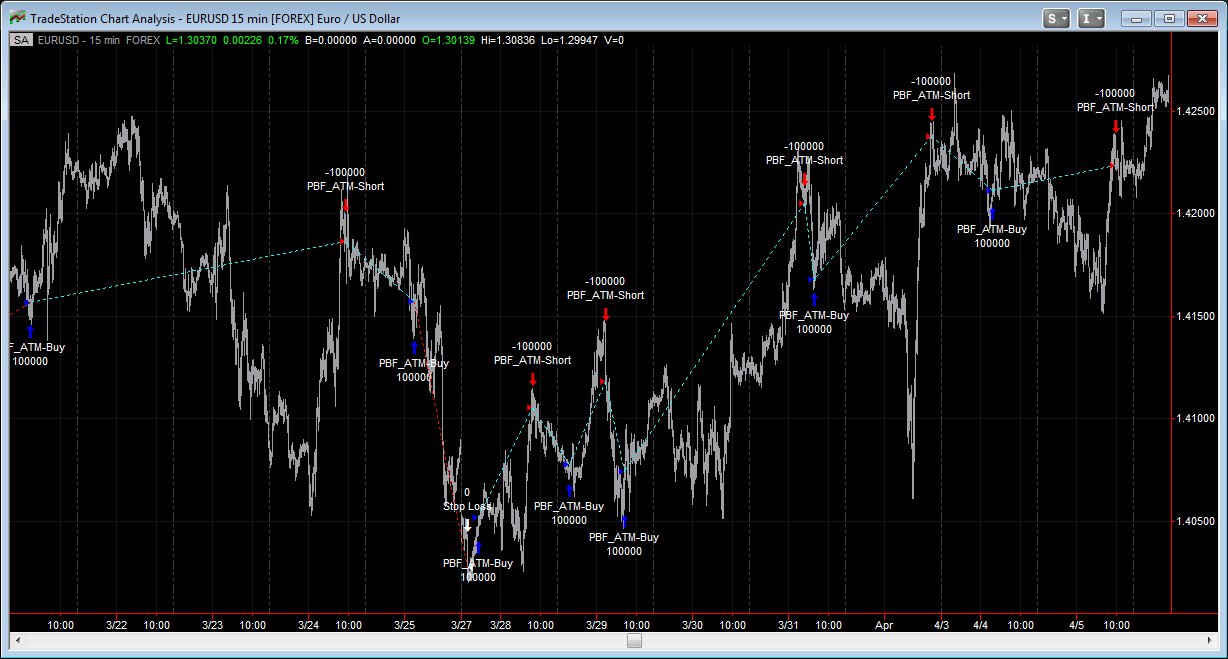
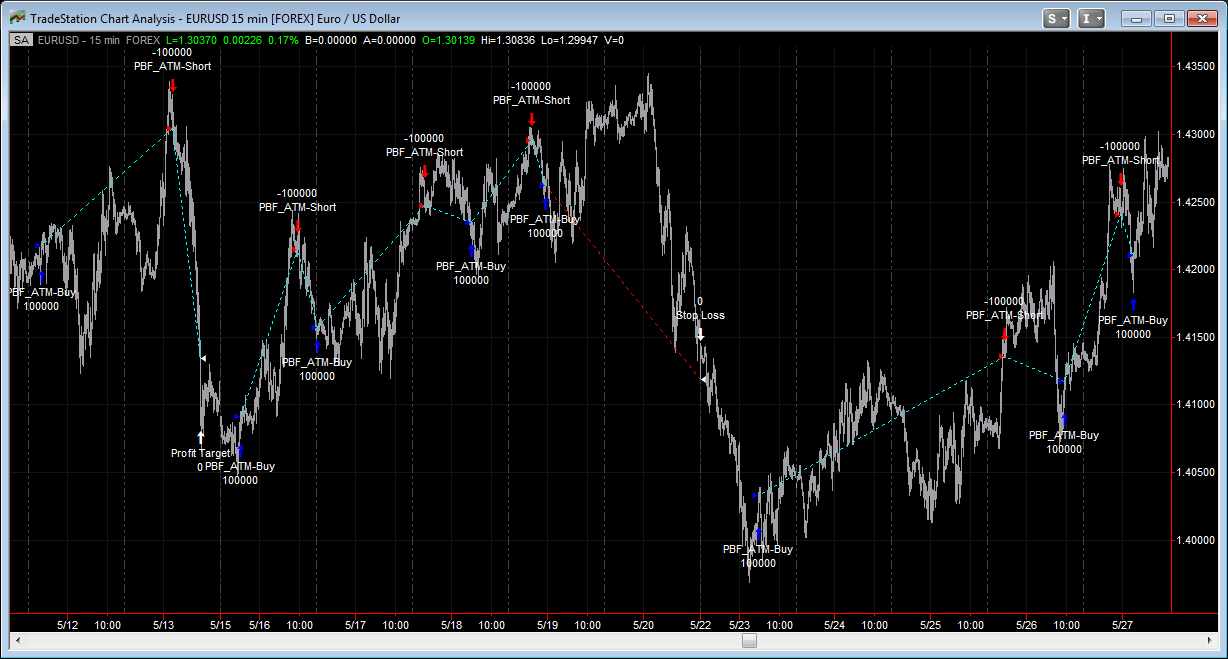
[* You know what the difference is between the charts I am showing you here, and charts you might find on other peoples websites, that also might look good? The charts I am showing you below are from two pairs, EURUSD and GBPUSD, 15 min time frame, from the past year and a half. Same market, same time frame, for months and months worth of performance. While the charts you might find elsewhere, you will see one chart from this symbol with this time frame, another chart from another symbol with another time frame, etc. That really tells me those charts are cherry picked. Even a bad system gets lucky once in a while and the vendor will be able to find that one good chart to show you, right? I am also showing you charts for months of worth, just like with my indicators. I squeezed the bar chart together as close as the platform allows so you will see more than two weeks data on each chart. And with other peoples website, you mght see a few days worth at most on each market. Don't just look at the performance report and believe in those numbers. Those numbers can easily be massaged/manipulated, that's how they are able to sell you a "winning system" on eBay for $297 so you can be on your way to ruin your trading account. And the high win rate, while means quite a bit in manual trading, means almost nothing in automated trading. It has to be combined with a few other numbers to be truly meaningful.]
Even more examples (PBF Personal ATM v.2) (I am really transparent, aren't I?)
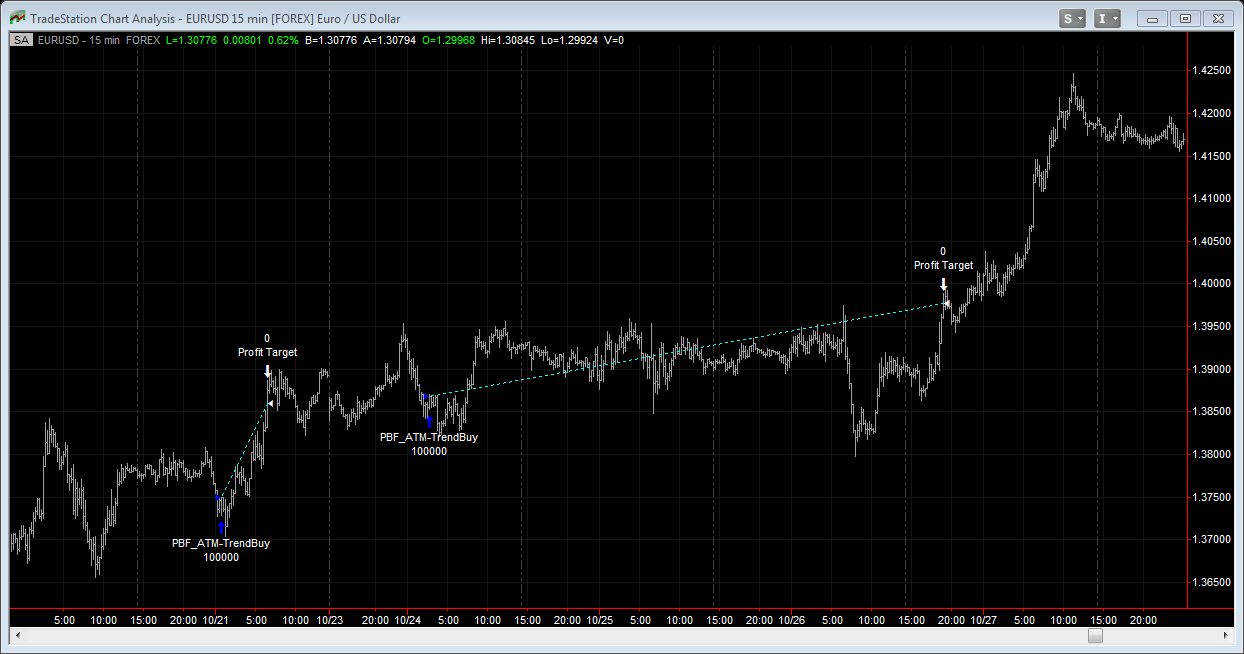
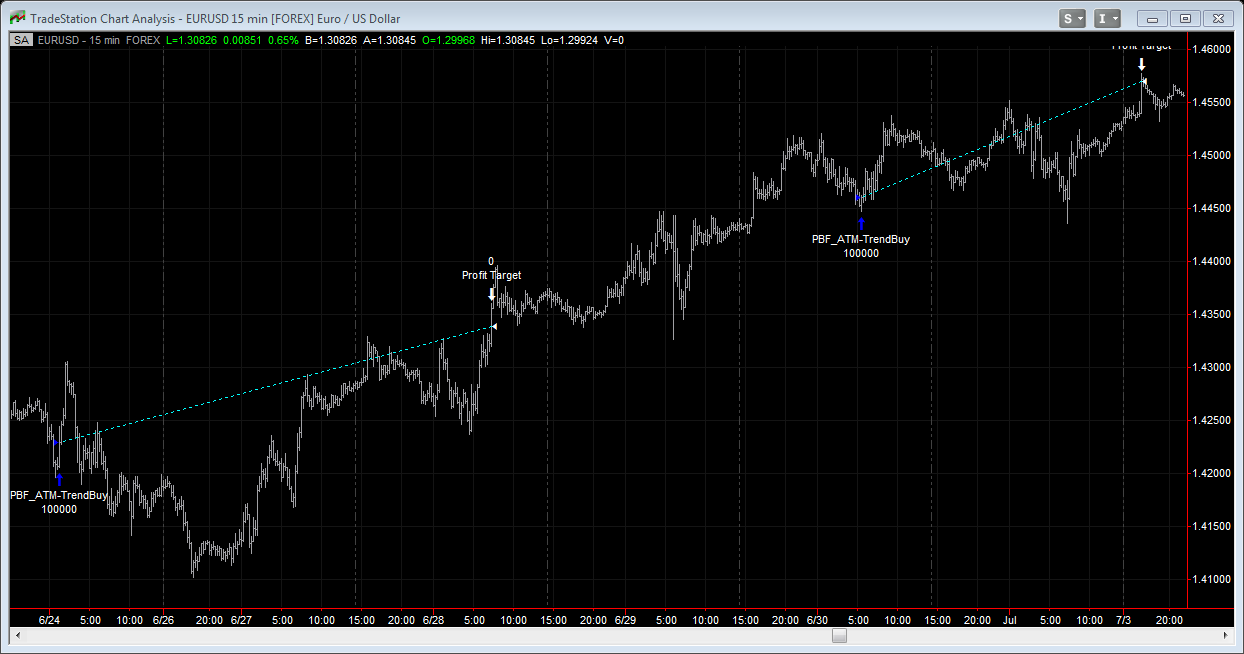
PBF Personal ATM v.2 with Trend Filter turned on:
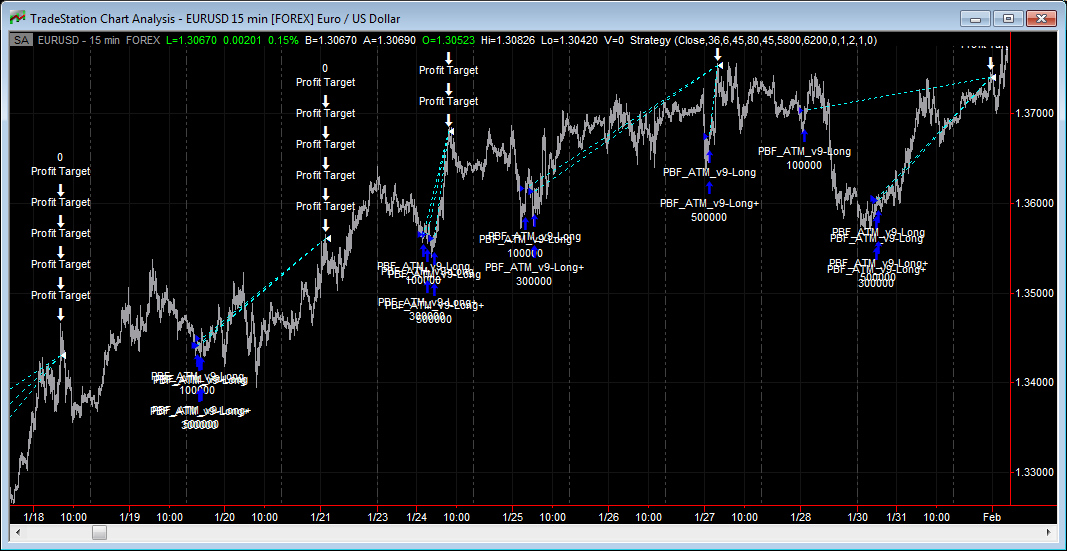
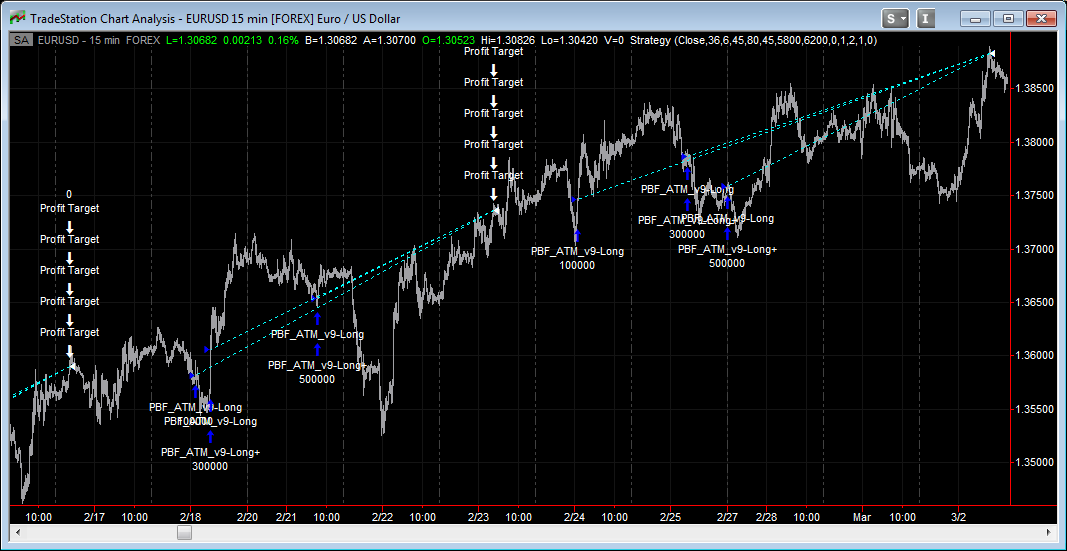
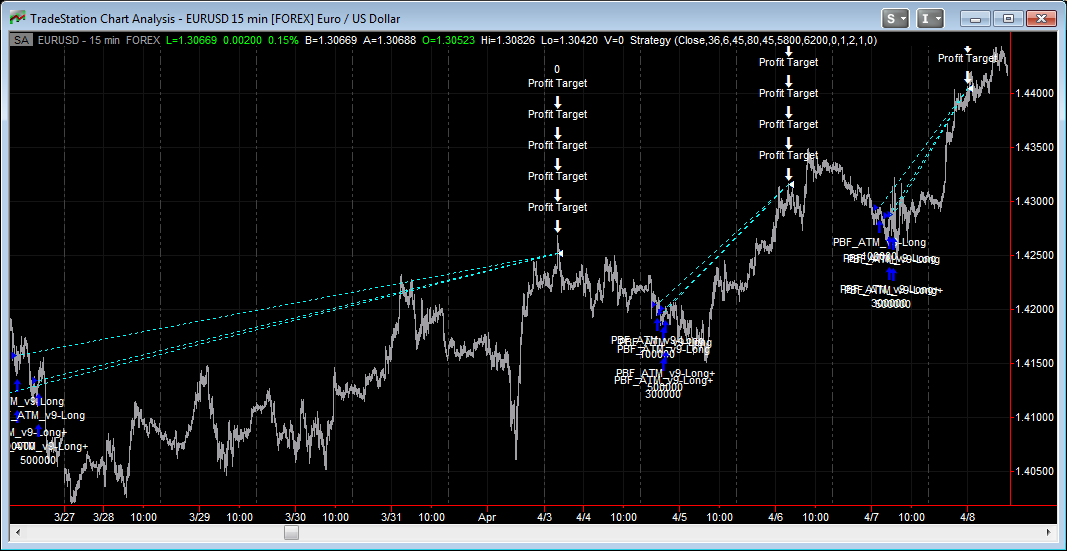
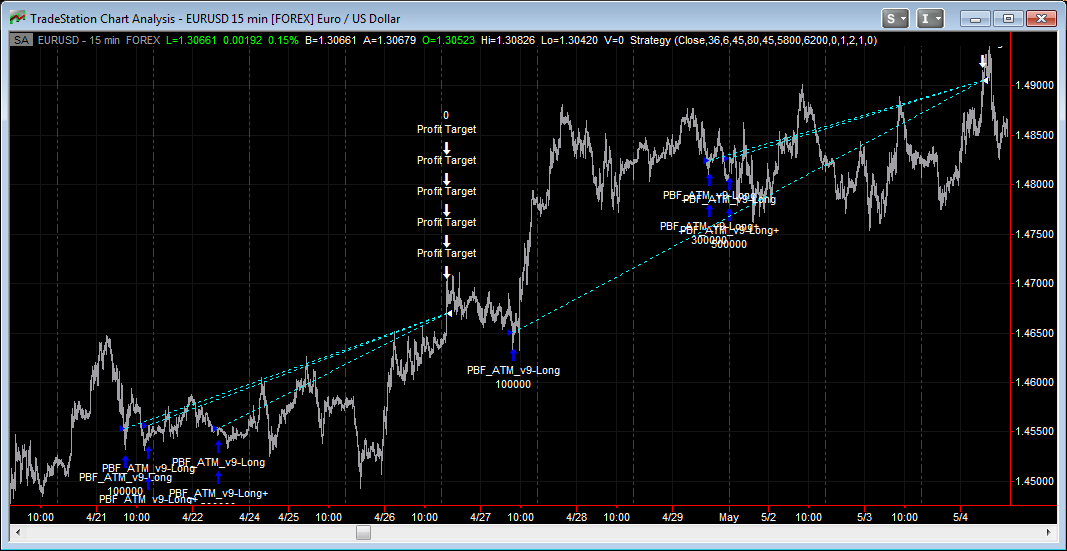
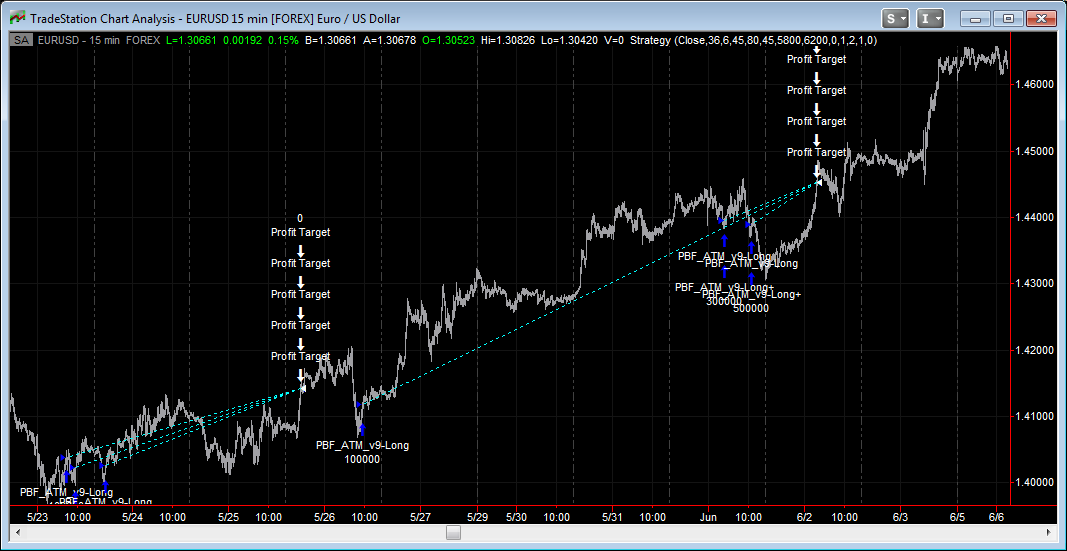
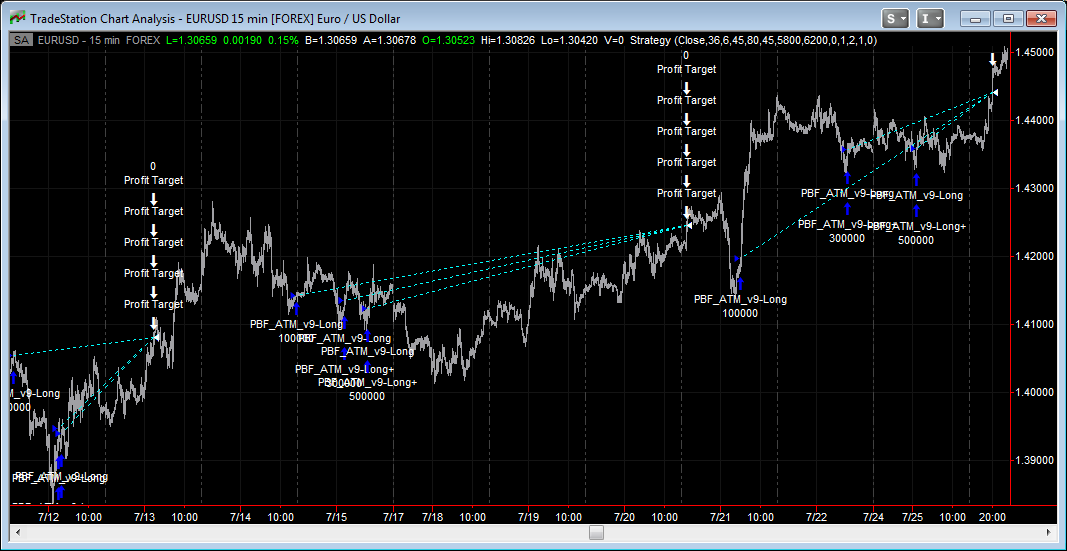
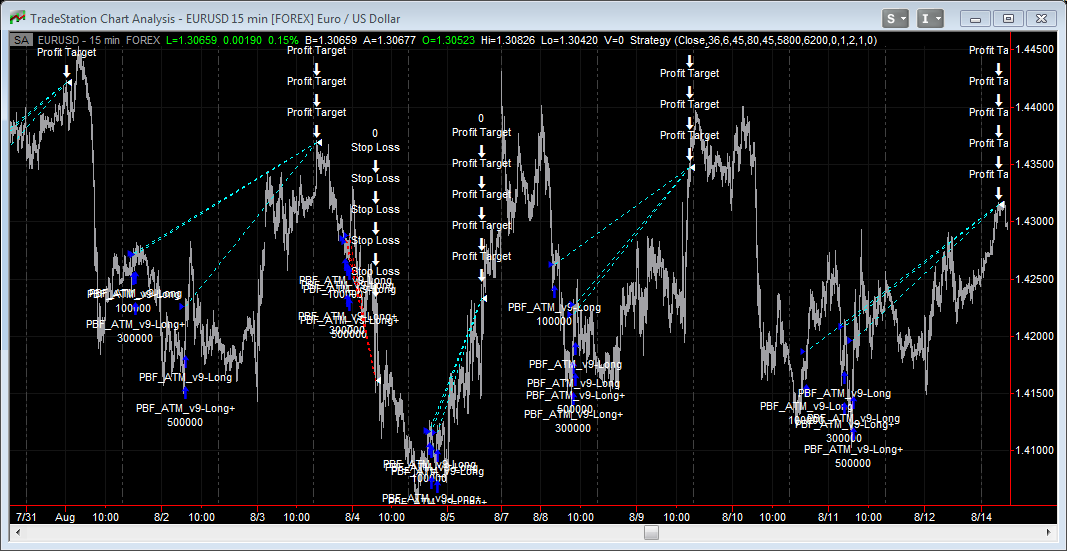
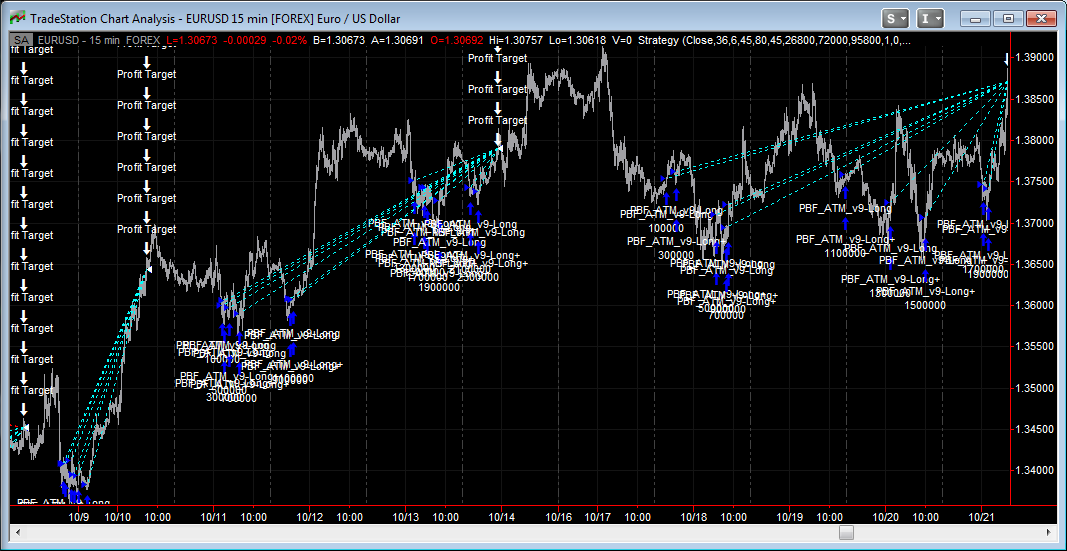
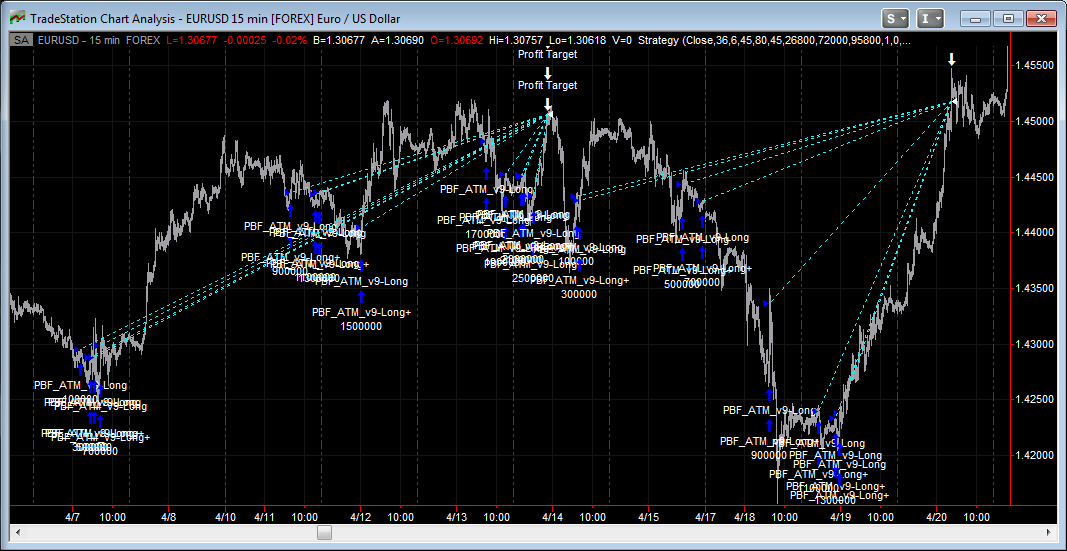
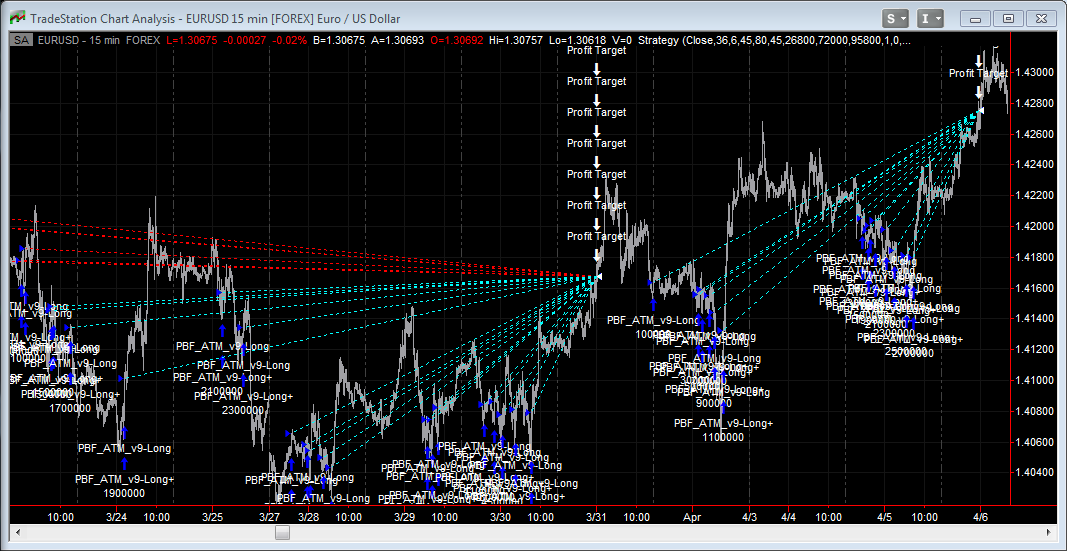
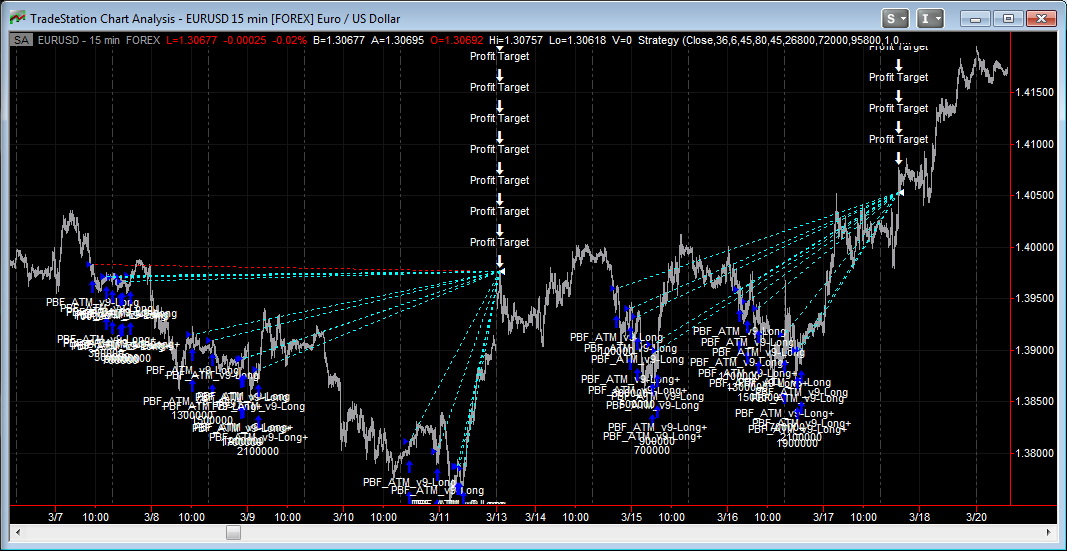
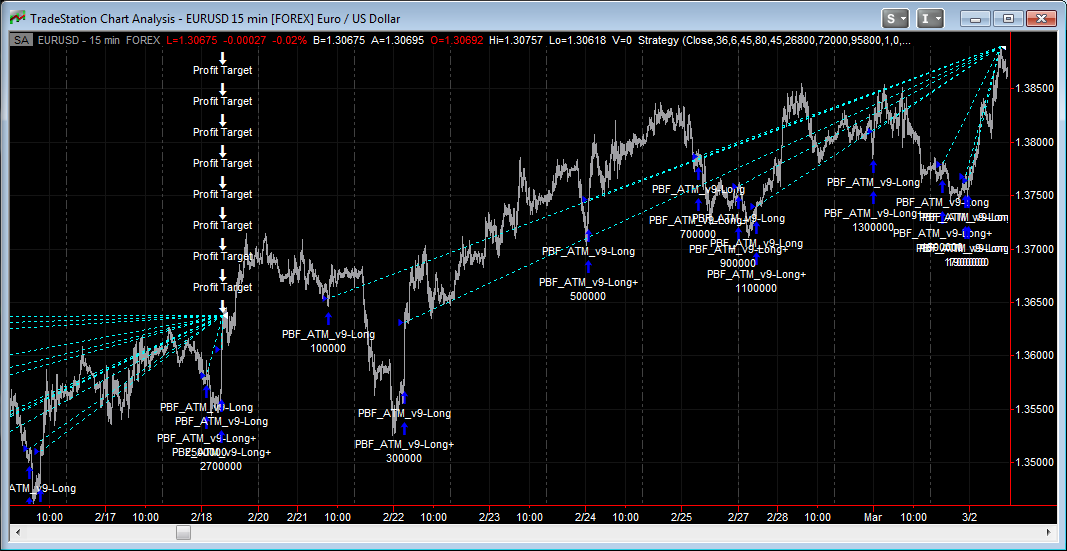
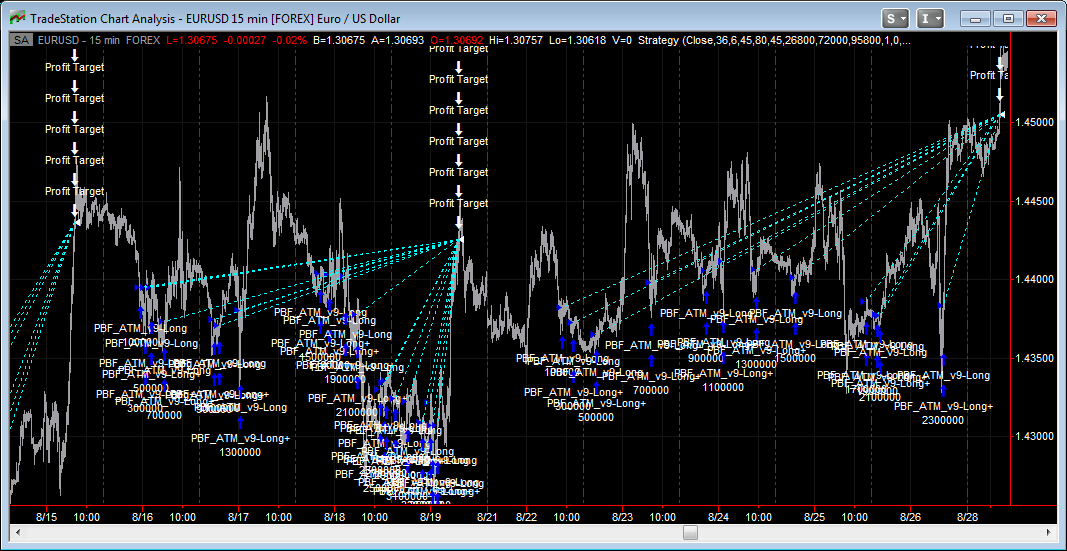
Introducing PBF Personal ATM version 9!! Now capable of scaling in, default at 5 times maximum!!
Now, if I do not limit how many times it can scale in, the maximum it added to the position in the past year was 48 times for a total of 49 lots. After taking out $22,660 in slippage, it ended up with a net profit of $557,616.70!!!! Percent Profitable is 74.05%, Profit Factor is 2.12, Average Trade Net Profit is $492.16.
I just can't believe that with the flip of a switch in my head, within a week (and mind you this was during Christmas holidays, I actually didn't work all week, only worked for two days) I had come up with 9 different versions! Now the problem is, I begin to forget which one is what and can't keep tracking with all the numbers and results and more importantly, the character of each idea! I know one or two of the 9 versions are probably no good and perhaps not realistic. But I am surprised that I got nothing in the past years, and 9 different versions within one week! Sometimes all you need is that light bulb above your head!!!
Don't get me wrong, the strategy is not going to add to losing positions to no end until it wipes out your account. It does have a profit target and a stop loss. Once either side is reached, it closes out all open positions and starts over again. It's not one of those "can't lose" strategy. Those never lose automated systems can't work and will eventually wipe you out, sooner or later, and it will happen.
******************************************************
I started this web page on December 16th, 2011. After years of not believing in automated systems, the switch in my head just flipped! Today is December 29th. In the last two weeks, I took a week off for the holidays, yet now I have 9 different versions of the "PBF Personal ATM". This morning I had a great idea. Played with it all day. Now I have another great strategy which is rather interesting. Applied it on different markets and time frames, it appears to be working on all of them. Introducing.......
"PBF FINA" strategy!!!
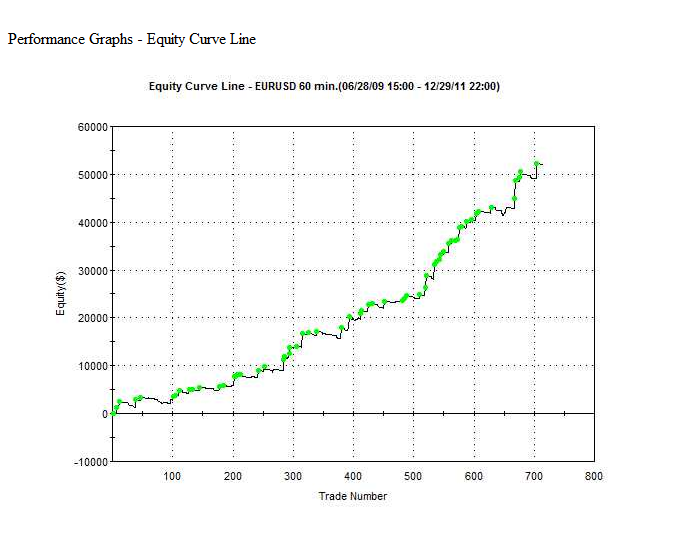
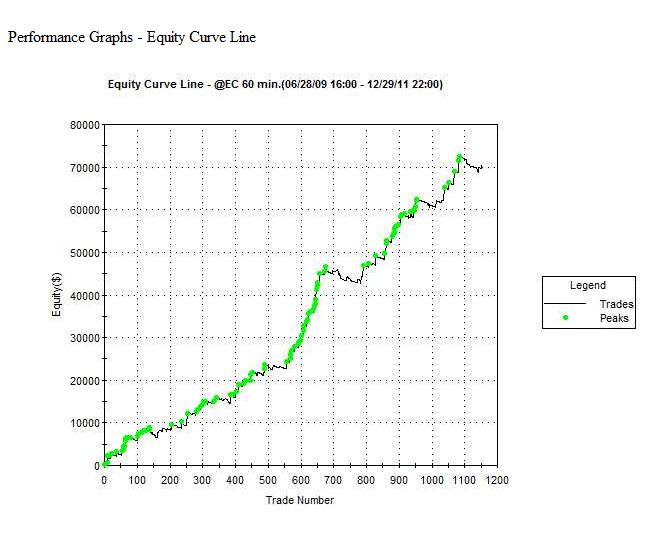
First let's look at the equity curve on a EURUSD Hourly chart going back 2.5 years. Bear in mind, I ddin't really try to optimize it, just "loosely" because I do not want to curve fit. It made over $50K in the past 2.5 years without significant drop in the equity curve.
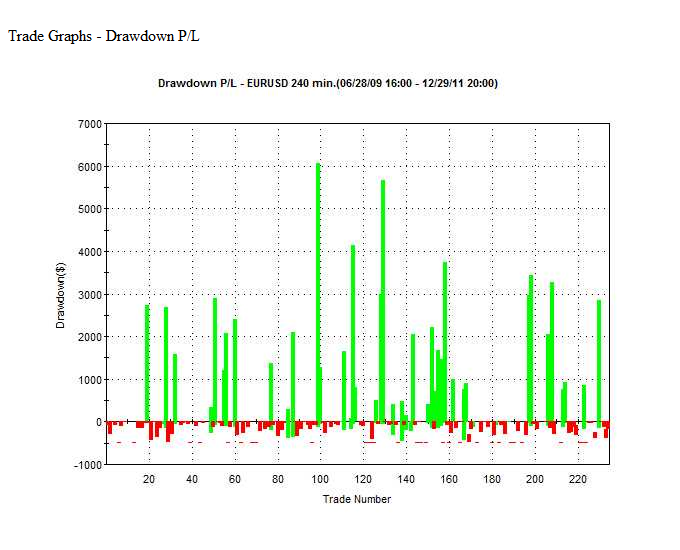
Next let's look at the graph of "Drawdown P/L". This is important because it shows you what your drawdowns are, compare to your winners. As we all know, we should cut the losses short and let the winners run. The machine will have no problem execute this plan.
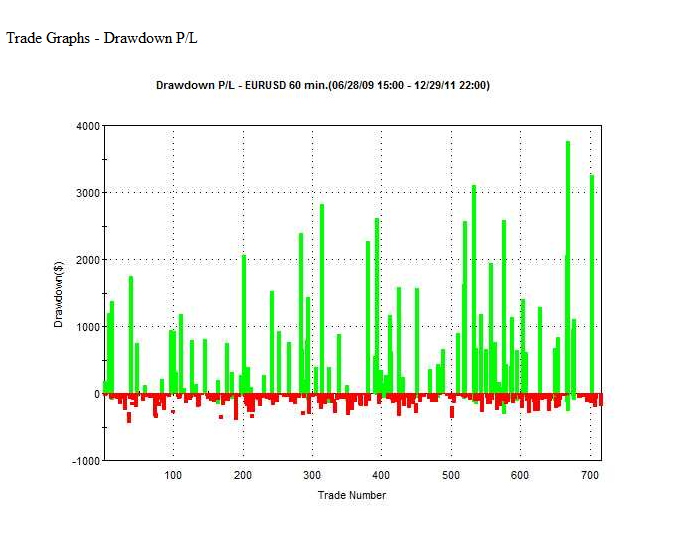
As you can see from the graph above, the losses are all relatively small compare to the winners. The whole idea behind this system is this. I want to find the BEST entry possible, enter the market when there is momentum, try to catch the big move when it occurs. However, it is easy to find good entries, but there is simply no way to know how far the market will run in your favor. So, if the trade doesn't go in my favor IMMEDIATELY, I kill it and wait for the next opportunity. Since it's the robot trading for me, it will never get tired and lose its patience. A low drawdown system is EXTREMELY important. Because you know it is SAFE, it will never wipe your account out in one single trade. You knwo each time you lose, you can only lose so little, but when you win, your winners will be so much larger, this gives you confidence and peace of mind to place large lot sizes. Let's face it, if you have a system that wins 99% of the time but that one loser can possibly wipe out your account, would you really dare to trade large? If not, then what's the point of auto trading!? You can't really make a living doing this, then why bother? With a low drawdown system, you can "bet the farm" or "load the boat", because even if you lose 10 times in a row, you still won't lose much. This will keep you in the game for the next big winner. Let's look at a chart to illustrate this idea.
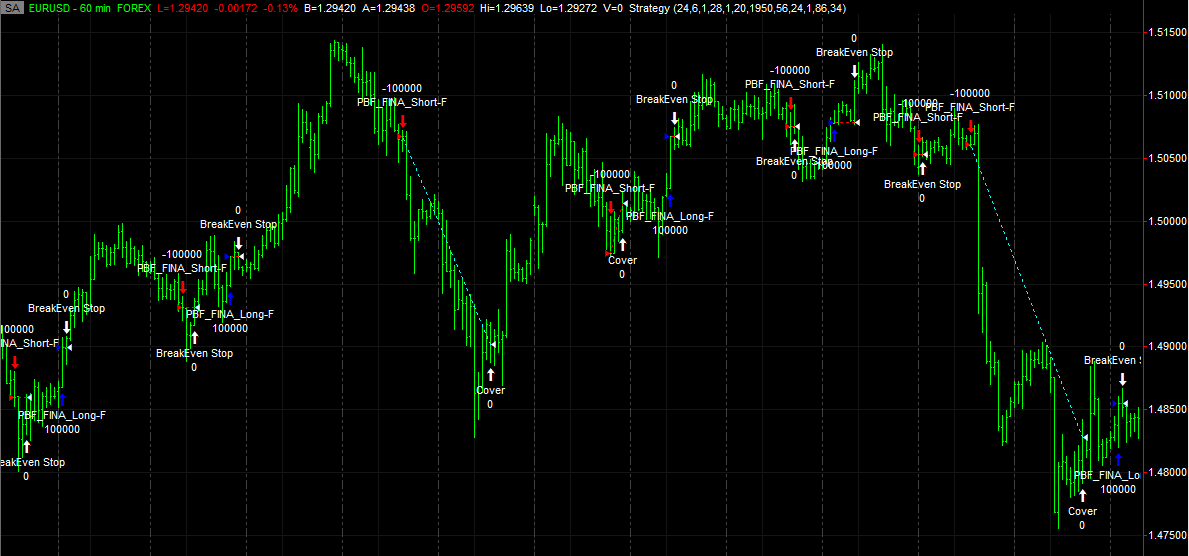
As you can see from the chart above, there are A LOT of breakeven trades. Most of them can actually be winners of 10, 20, 30 pips or more, but got stopped out prematurally. It tries and tries and tries until it hits a homerun, and there is no shortage of this kind of homerun in the markets. There is one loser in the middle of the chart, which is also small. There are two winners, which are HUGE, one for over 150 pips and the other over 200 pips. That's what the system is aiming for. This looks very realistic because the system didn't "get lucky", bought and sold at swing extremes. The logic is to try and get in when the market is about to move, and get out if it doesn't work out immediately. The chart clearly shows that. Now it all sounds great, right? Here comes the shocking part! Let's look at the performance report next.
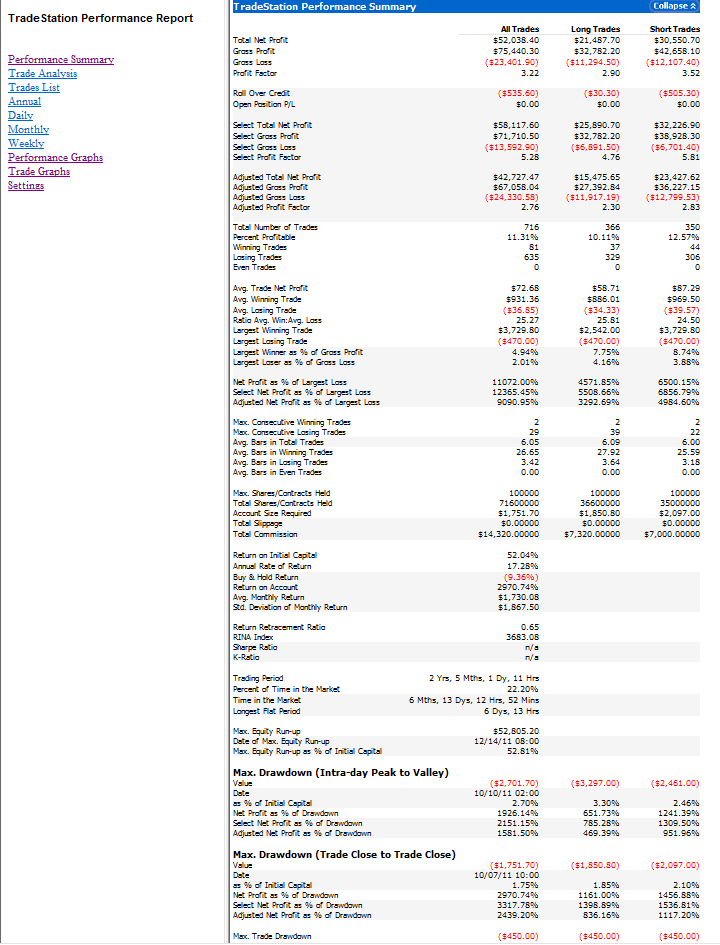
Sorry for the small font! I was trying to squeeze everything into one screen shot so I can post all information without holding back. As you can see, the Profit Factor is 3.22, which is execellent. It made $52,038.40 net profit in 2 years, 5 months, 1 day and 11 hours. Longest flat period is only 6 days and 13 hours. The Max. Trade Drawdown is only $450, the Max Drawdown Trade Close to Trade Close is only $1,751,70, the Max Drawdown Intra-day Peak to Valley is only $2,701,70. The RINA Index is 3683.08, the Ratio Avg. Win: Avg. Loss is 25.27, you can see that $14,320 as "commission" are taken out from the net profit. The average winner is $931.36, that's over 93 pips, and the average loser is, get this, $36.85!!! Of which $20 is automatically deducted from each trade as "commission". In other words, if you have a breakeven on the chart, as far as this report is concerned, it consider it as a loser and it at least loses $20 by default. A lot of reports look nice without commissions/slippage. Once they take that into account, the equity curve goes the other way! The largest winner is $3,729.80, the largest loss is only $470. So far it all sounds fantastic, right? Here is the shocking part: The Winning rate is only 11.31%!!! Can you believe this?? How is it possible, right? This really tells you never believe in the winning percentage of a system! If the drawdown is large, it is not tradable! I'd rather go with a low winning perfectage system with tiny drawdown than a high win rate system that could potentially wipe out my account with one or two losers. But once again, in reality the winning rate of this PBF FINA system should be way higher than 11.31%, because there are a large amount of breakeven trade, which, as explained above, are considered losers of at least $20 per contract by this report. If all breakeven trades count as neutral, the winning rate of this system will be much, much higher. The important thing is, while I know I might hit a lot of losing trades in a row before getting a winner, I am comfortable knowing that in the past 30 months, the maximum drawdown is within my comfort zone, I can use proper money management and build my account exponentially!
Here is why the low win rate doesn't scare me with this strategy. If you look at the chart above and count carefully, you will see that we have only TWO winners, but in fact just ONE loser, with NINE breakeven trades. Again, breakeven trades count as losers and I actually took $20 off of each beakeven trades in this report (that's where the $14,320 commission comes from, while there is no commission trading forex, I took away $20 from each trade made, and it made a total of 716 trades, 716x20 = $14,320). Because the net profit is so high and the maximum drawdown is so low, even if you double that commission figure as slippage, which I don't think you'd have 4 pips of slippage every trade every time, you'd still end up with some very good profit. But if we count all breakeven trades as losers, on this particular chart, we have two winners out of 12 trades, which means the win rate is about 16.66%. The only losing trade looks like around 50 pips loss, the two winners probably captured around 400 pips. So that's a net of 350 pips. For the nine breakeven trades, pick a number, how many pips do you want to take out from each one? At 4 pips slippage per trade, you are still just looking at 36 pips. You stil net more than 300 pips in this case. This is why the low win rate on paper doesn't bother me. The average win is $931.36 and average loss is $36.85, the risk/rewad is a stunning 25.27!!!! This means even if my win rate is 4%, I should still be above breakeven! And my win rate is almost 3 times of that! Now, if we look at it from a different angle, if we count the breakeven trades as neutral, not losing trades, or even as winners,but still take out the $20 per trade as cost for trading, then in this case, we'd have 11 winners and 1 loser, for a win rate of 91.67%!! So this really depends on how you look at it! 11.31% or 91.67%, huge difference, but the result is the same: You make money, lots of it!
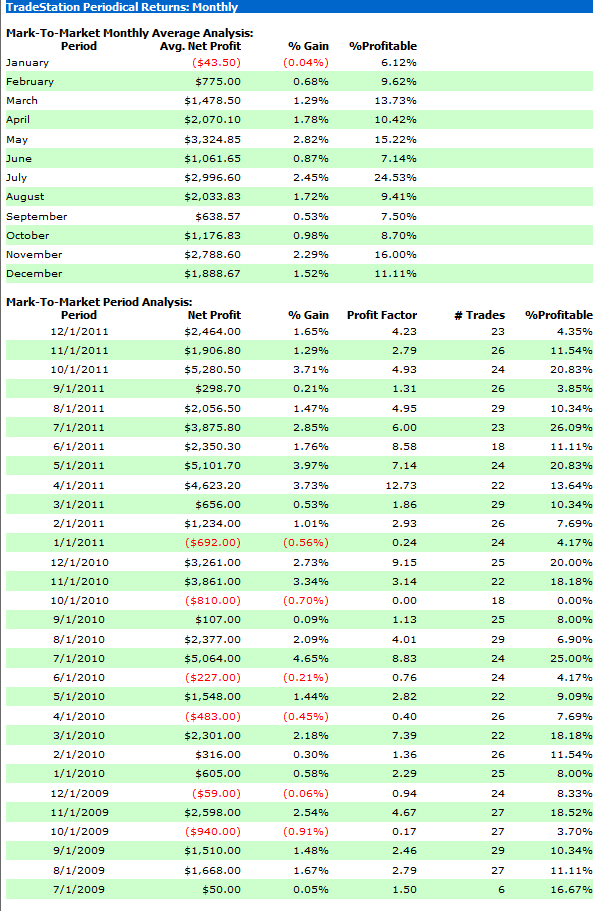
Now, if you can bear not looking at your account every day, just consider it as "one trade a month", try not to interfere, at the end of the month in the past 30 months, you'd have 6 losing months, but those losses are so tiny, one big winning month can wipe that out, and you get to keep the profit made from the other 23 months. Besides, the year 2011, which is this year, you only have one losing month back in January for $692. This tells me, if I optimize the strategy with the most recent data instead of going back for 2.5 years, the result could be better.
Now are you confident trading a system like this one? I think I am!!! The problem for me really is, I have a dozen strategies that work within two weeks, I really lost track on which is what!!!
Here is FINA applied on Euro Contract for the same period of time if you are a Futures guy. $25 per round turn trade is accounted for. Trading just one contract it would have made $70K in the past 2.5 years.
Below is the Drawdown P/L chart on EURUSD 4 Hour chart. Same idea. The losses are very small, not more than $500 per trade, most of them much smaller, yet many winners are around $2000-3000 range, 3 of them are between $4000 and $6000 per trade. The Profit Factor is 3.81 for this one, yet the win rate is only 17.52%.
Disclaimer: All TRADING involves risk, while there is a potential to make a substantial amount of money, you CAN LOSE a substantial amount of money as well, no matter what method you use. All trading involves risk; past performance is not necessarily indicative of future results.
Commission Rule 4.41(b)(1)(I) hypothetical or simulated performance results have certain inherent limitations. Unlike an actual performance record, simulated results do not represent actual trading. Also, since the trades have not actually been executed, the results may have under- or over-compensated for the impact, if any, of certain market factors, such as lack of liquidity. Simulated trading programs in general are also subject to the fact that they are designed with the benefit of hindsight. No representation is being made that any account will or is likely to achieve profits or losses similar to those shown.
ONE OF THE LIMITATIONS OF HYPOTHETICAL PERFORMANCE RESULTS IS THAT THEY ARE GENERALLY PREPARED WITH THE BENEFIT OF HINDSIGHT. IN ADDITION, HYPOTHETICAL TRADING DOES NOT INVOLVE FINANCIAL RISK, AND NO HYPOTHETICAL TRADING RECORD CAN COMPLETELY ACCOUNT FOR THE IMPACT OF FINANCIAL RISK IN ACTUAL TRADING. FOR EXAMPLE, THE ABILITY TO WITHSTAND LOSSES OR TO ADHERE TO A PARTICULAR TRADING PROGRAM IN SPITE OF TRADING LOSSES ARE MATERIAL POINTS WHICH CAN ALSO ADVERSELY AFFECT ACTUAL TRADING RESULTS. THERE ARE NUMEROUS OTHER FACTORS RELATED TO MARKETS IN GENERAL OR TO THE IMPLEMENTATION OF ANY SPECIFIC TRADING PROGRAM WHICH CANNOT BE FULLY ACCOUNTED FOR IN THE PREPARATION OF HYPOTHETICAL PERFORMANCE RESULTS AND ALL OF WHICH CAN ADVERSELY AFFECT ACTUAL TRADING RESULTS.
THERE IS RISK OF LOSS IN ALL TRADING. PAST PERFORMANCE IS NOT INDICATIVE OF FUTURE RESULTS. ALL RESULTS ARE HYPOTHETICAL. NO IMPLICATION IF BEING MADE THAT ANYONE UTILIZING ANY OF THE INDICATORS OF PAINTBARFACTORY.COM HAS OR CAN OBTAIN SUCH PROFITS AND RESULTS. THE INFORMATION SUPPLIED ON THIS WEBSITE IS MERELY A PRESENTATION OF TRADING TOOLS AND STRATEGIES, FOR INSTRUCTIONAL AND EDUCATIONAL PURPOSES ONLY.
This is not a prospectus; no offer on our part with respect to the sale or purchase of any securities is intended or implied, and nothing contained herein is to be construed as a recommendation to take a position in any market. The material presented herein has been obtained or derived from sources believed to be accurate, but we do not guarantee its accuracy or completeness. There have been no promises, guarantees or warranties suggesting that any trading will result in a profit or will not result in a loss. The TRADER is responsible for his own actions.
|